
Figure 5.
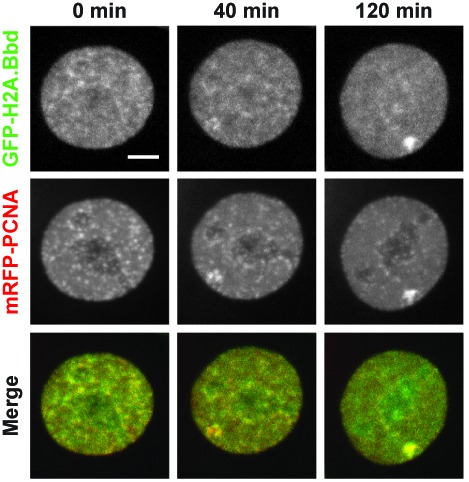
H2A.Bbd follows PCNA at replication foci. Selected frames of time-lapse imaging (see Supplementary movie) of MEF cells stably expressing GFP-H2A.Bbd (green) transfected with mRFP-PCNA (red). Z-stacks were collected every 20 min over night using a spinning disk microscope equipped with temperature, humidity and CO2 control. Shown are maximum intensity projections. Scale bars: 5 μm.