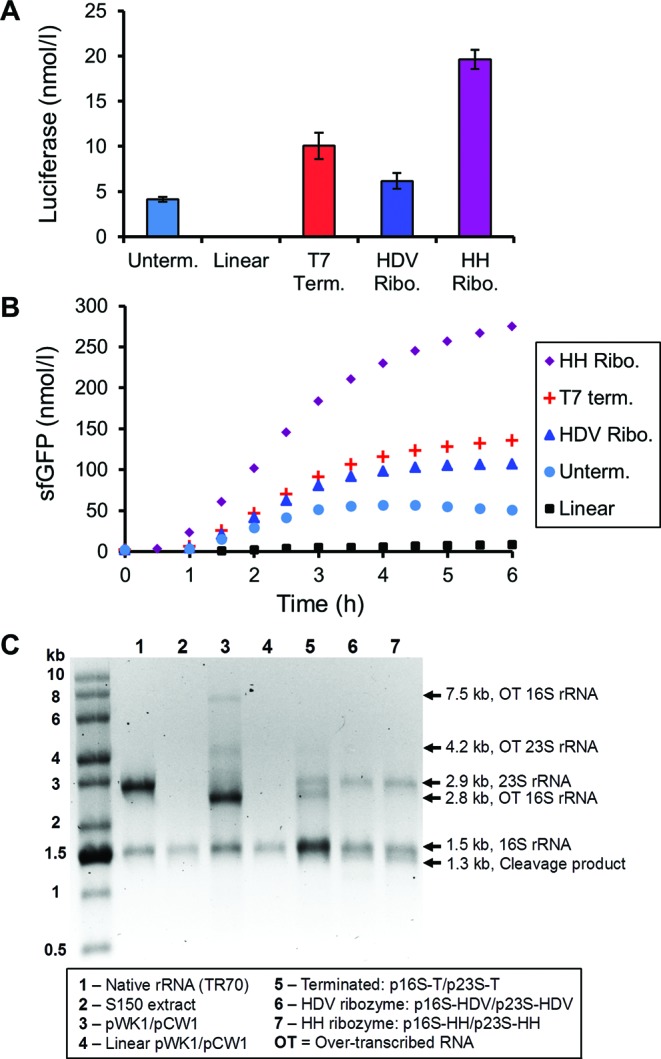
Figure 2.

Comparison of iSAT reactions utilizing separate plasmids encoding 16S and 23S rRNA with various 3′ gene modifications. (A) Comparison of luciferase production in iSAT reactions utilizing separate 16S and 23S plasmids with 3′ gene modifications shown in Figure 1. Reactions were incubated at 37°C for 4 h. (B) Same comparison as (A) for sfGFP production, measured at 30 min intervals from 0 to 6 h while incubating at 37°C. For panels (A) and (B), values show average reporter protein concentrations above background for at least three independent reactions. Error bars in (A) represent standard deviation (s.d.). (C) RNA denaturing gel of iSAT reactions utilizing separate 16S and 23S plasmids with various 3′ gene modifications. TR70 control lane contains 1 μg purified E. coli rRNA. 16S rRNA in S150 extract control lane indicates presence of residual 16S rRNA in extract. Over-transcribed (‘OT’) bands are RNA bands that represent transcription beyond the intended 16S or 23S rRNA gene and were identified by individual expression of 16S or 23S constructs (Supplementary Figure S3).
