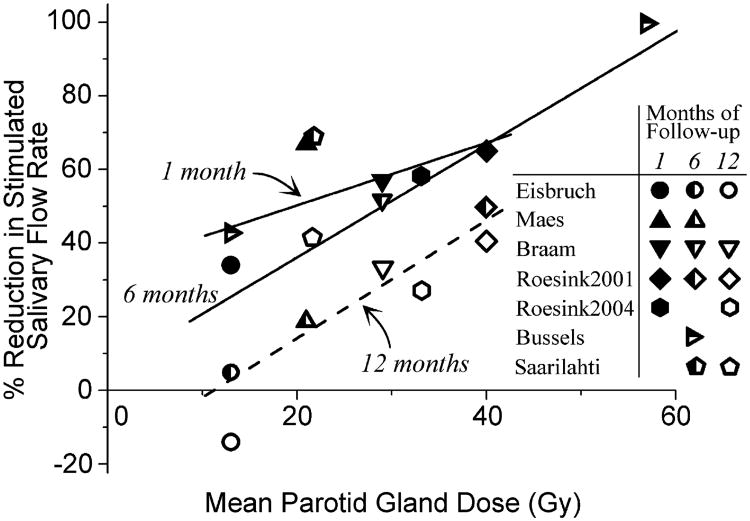
Fig. 2.
Mean percentage of reduction in stimulated salivary flow rate vs. mean parotid gland dose for different follow-up durations (8, 10, 12, 14, 15, 16). Follow-up durations of 1, 6, and 12 months represent ranges of 1–1.5, 6–7, and 12 months, respectively. Linear fits of data from different follow-up intervals shown. Dose–response effect appears present at all times, with shift of data to right with time, suggesting functional repair or regeneration.

