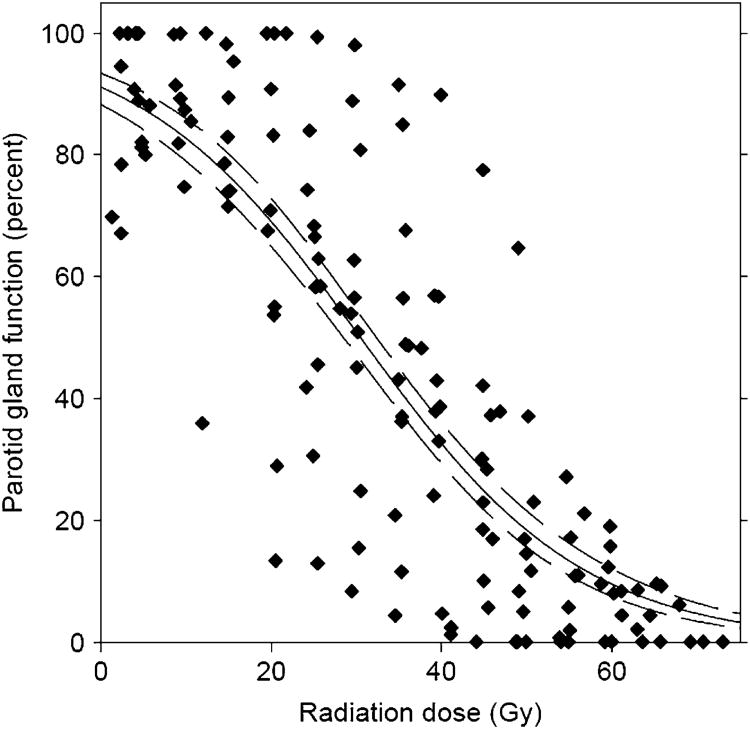
Fig. 4.
Population-based dose vs. local function response (salivary function at rest) from imaging study by Buus et al. (2). Local functional decline in metabolic clearance of parotid salivary glands vs. local dose, according to voxel-by-voxel estimated time-activity curves of intravenously injected C11-methionine. Data points from 12 patients shown, along with best-fit curve and 95% confidence intervals of curve fit. Individual gland curves reported by Buus et al. (2) deviated significantly from this population average curve (reproduced from Buus et al. [2], used with permission.) This population curve demonstrated functional decline in salivary function even at low doses.

