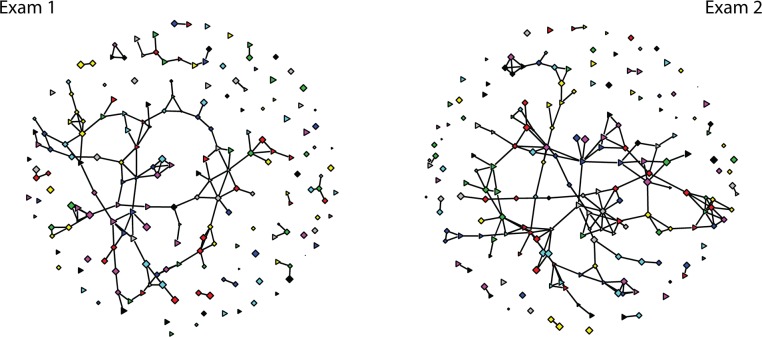
Figure 2.
Sociographs representing study networks for the first and second exam. Male students are represented as triangles and females as diamonds. The color of each node corresponds to the lab section each student was in. Edges (lines) between nodes in the networks represent a study partnership for the first and second exam, respectively.

