Figure 1.

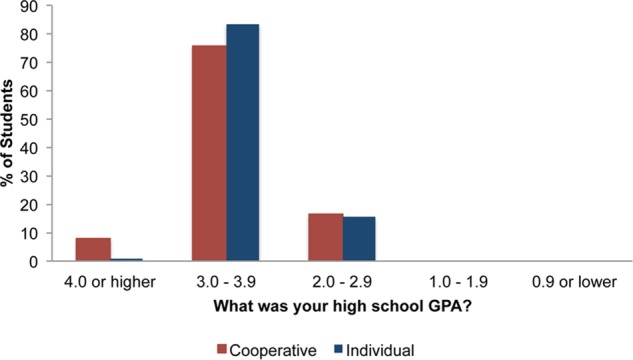
Self-reported high school GPA distributions of students in cooperative and individual sections. Distributions are significantly different (p = 0.04). n = 102 cooperative, 98 individual.

Self-reported high school GPA distributions of students in cooperative and individual sections. Distributions are significantly different (p = 0.04). n = 102 cooperative, 98 individual.