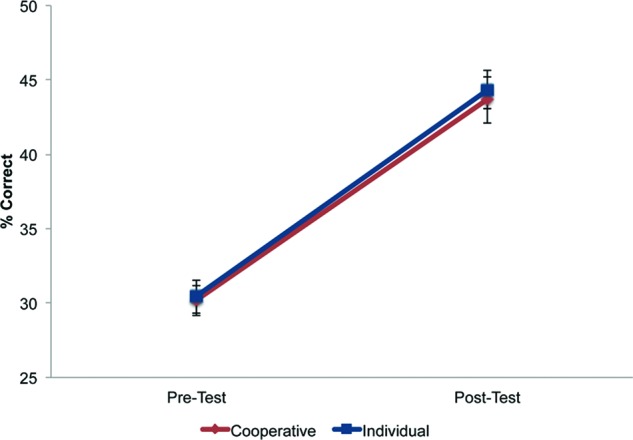
Figure 3.

Average scores on the key concept test (pre and post) for both treatments. Bars represent SE. Means are significantly higher on the posttest compared with the pretest for both the cooperative (p < 0.0001) and individual (p < 0.0001) sections but are not significantly different between the sections on either the pretest (p = 0.86) or posttest (p = 0.73). n = 86 cooperative, 92 individual.
