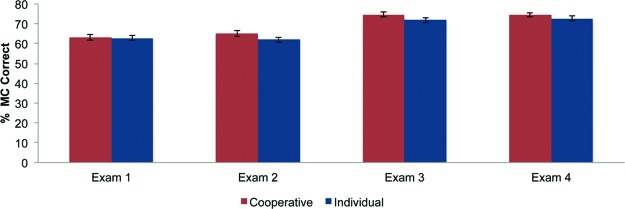
Figure 4.

Class means (unadjusted) for percent correct on multiple-choice (MC) portions of exams. There were no significant differences between treatments based on ANCOVA. Exam 1 (p = 0.89); exam 2 (p = 0.13); exam 3 (p = 0.14); exam 4 (p = 0.29). n = 102 cooperative, 98 individual.
