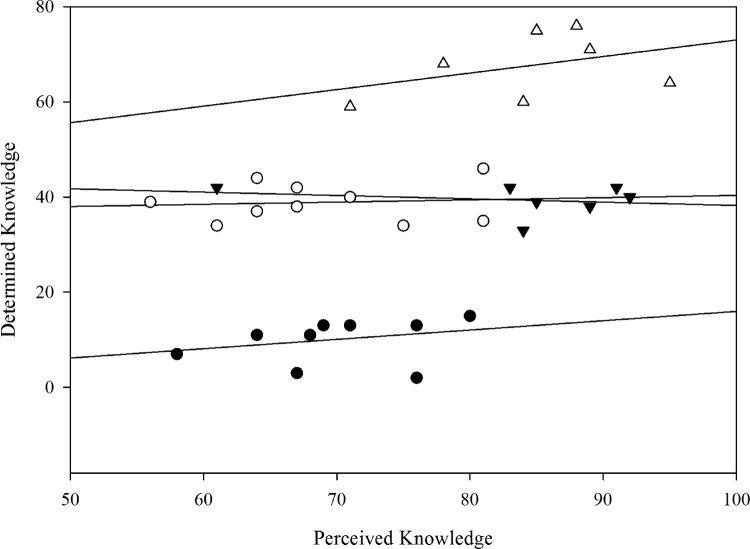
Figure 2.
Relationship between total perceived and determined knowledge scores in upper- and lower-quartile students on the pre- and posttest. The dark circles represent the relationship between lower-quartile students’ perceived and determined knowledge on the pretest (n = 9, r2 = 0.7619), and the open circles represent the relationship between upper-quartile students’ perceived and determined knowledge on the pretest (n = 9, r 2 = 0.0086). The filled and open triangles represent the relationship between perceived and determined knowledge on the posttest for lower-quartile (n = 7, r2 = 0.0513) and upper-quartile (n = 7, r2 = 0.1579) students, respectively. The solid lines represent the regression for each relationship.

