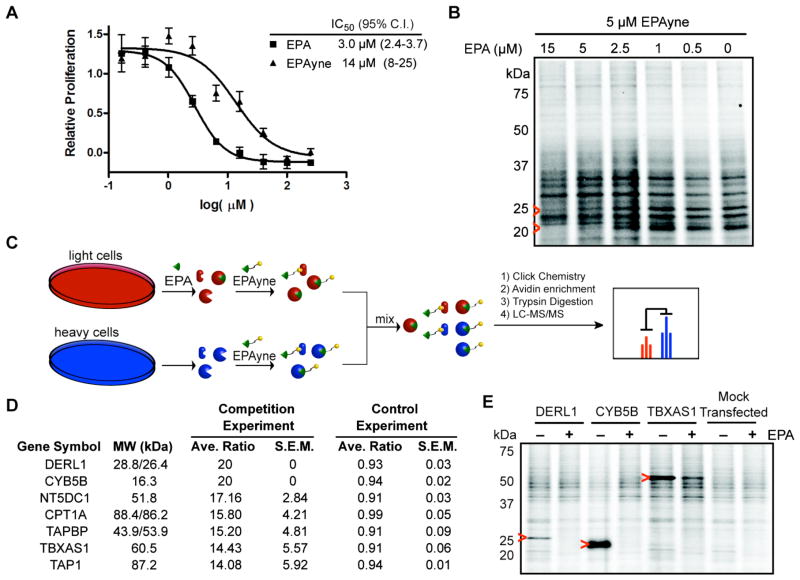
Figure 4. Cytoxicity and Proteomic Profiling of EPA and EPAyne.
(A) Inhibition of HL-60 cell proliferation by EPA and EPAyne as measured using a WST-1 assay. (B) In situ treatment of HL-60 cells with EPAyne alone or in competition with EPA followed by conjugation to an azide-rhodamine reporter tag, SDS-PAGE, and fluorescent scanning. Red arrows highlight competed signals. (C) Schematic of competitive ABPP-SILAC. Cells are enriched with heavy or light isotopic tags and treated with DMSO or EPA, respectively, and followed by addition of EPAyne. EPA labeled proteomes are mixed, conjugated to biotin using click chemistry, enriched, and analyzed by MudPIT. (D) List of putative EPA targets in HL-60 cells. Average ratios are from duplicate runs and standard error results are reported. In the control experiment, heavy and light cells are treated with EPAyne alone (E) Validation of three high affinity targets DERL1, CYB5B, and TBXAS1 by labeling of transiently transfected 293T cells with EPAyne (5 μM) ± EPA (15 μM). Red arrows indicate the target’s expected molecular weight.

