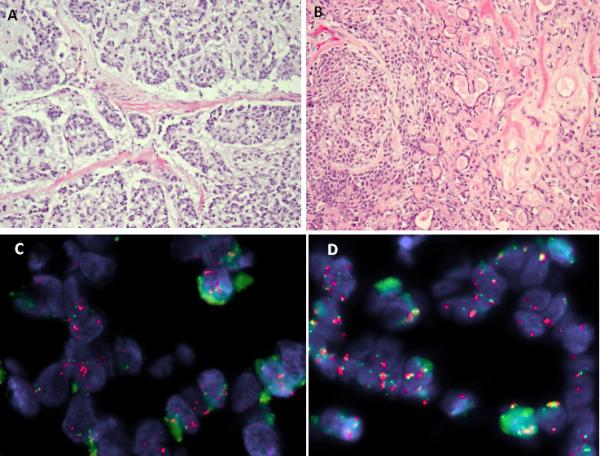
Figure 3.

Myoepithelial carcinoma ex-pleomorphic adenoma. A. Morphologic appearance showing cords and nests of epithelial cells with an infiltrative pattern within a myxoid stroma (ME41). B. Small component of benign pleomorphic adenoma seen adjacent to the malignant myoepithelial component (ME41). C. FISH showing break-apart PLAG1 signals, associated with amplification of the centromeric portion (red); D. similar finding for FGFR1 which show rearrangement and centromeric portion amplification (orange), while the telomeric part is not (green).
