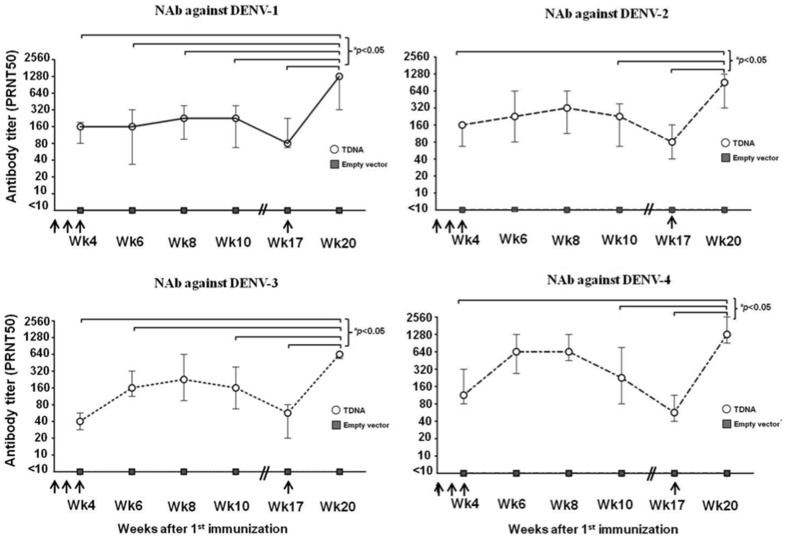
Figure 3. Kinetics of NAb responses following TDNA prime-boost immunization.
NAb titers of individual mice sera (n = 6), against each of the four dengue serotypes were shown separately. Opened circle and grey square represent the median PRNT50 titer with inter-quartile ranges for the TDNA group and the empty vector group, respectively. Arrows represent the injection of each dose of TDNA. * indicates p<0.05.

