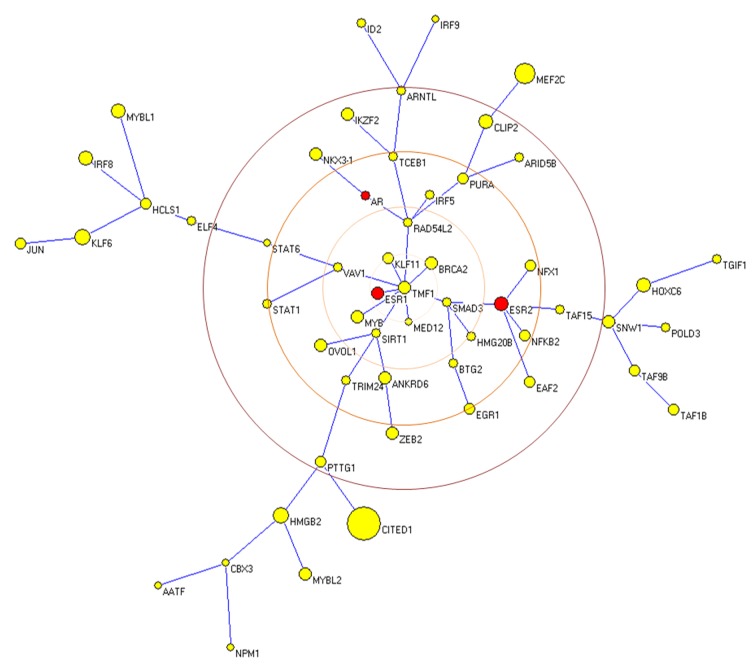
Figure 4. Differentially expressed TF and transcription regulation-related genes.
Transcription regulation-related genes indentified by the IPA Ingenuity program and showing differential expression in those subgroups containing enrichment terms. Red and green colors highlight the up- or down-regulated genes as compared with the control group, respectively. A minimum spanning tree is used to show the correlation among the expression variation of the differentially expressed genes (yellow) plus the androgen receptor (AR) and estrogen receptors (ESR1 and ESR2) (red) in human tissues. Each gene is indicated as a vertices and their size represent the standard deviation of their fold changes in different tissues. The edge length is the distance calculated from the correlation matrix as explained in M&M. Of note, are the centrality of TMF1 and the short distances between the pairs AR-NKX3-1, ESR1-BRCA2, and ESR2-NFKB2.

