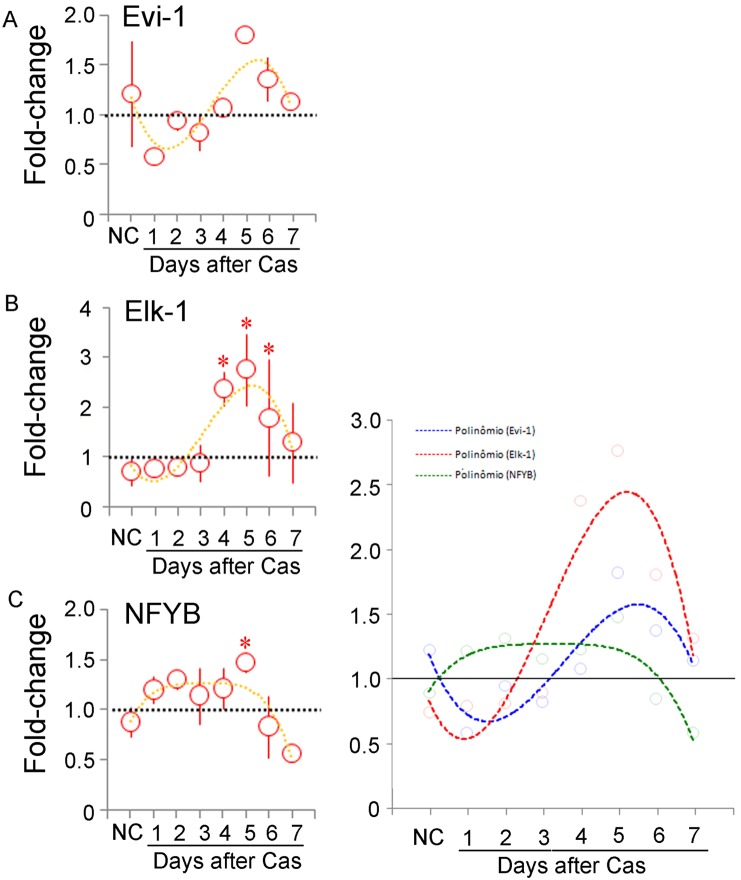
Figure 8. Kinetics of Evi1, Elk1 and Nfyb expression.
Quantitative RT-PCR determination of the mRNA content for the Evi1 (A), Elk1 (B) and Nfyb (C) genes in the prostate of non-castrated (NC) and castrated rats up to 7 days after surgery. The fold-change variation with respect to the controls is shown as the mean ± standard variation (n = 3 for each time point). The asterisks indicate p<0.05. The dotted lines in each figure correspond to the fourth-power exponential fitting curve, and are shown together for the sake of direct comparison in D.

