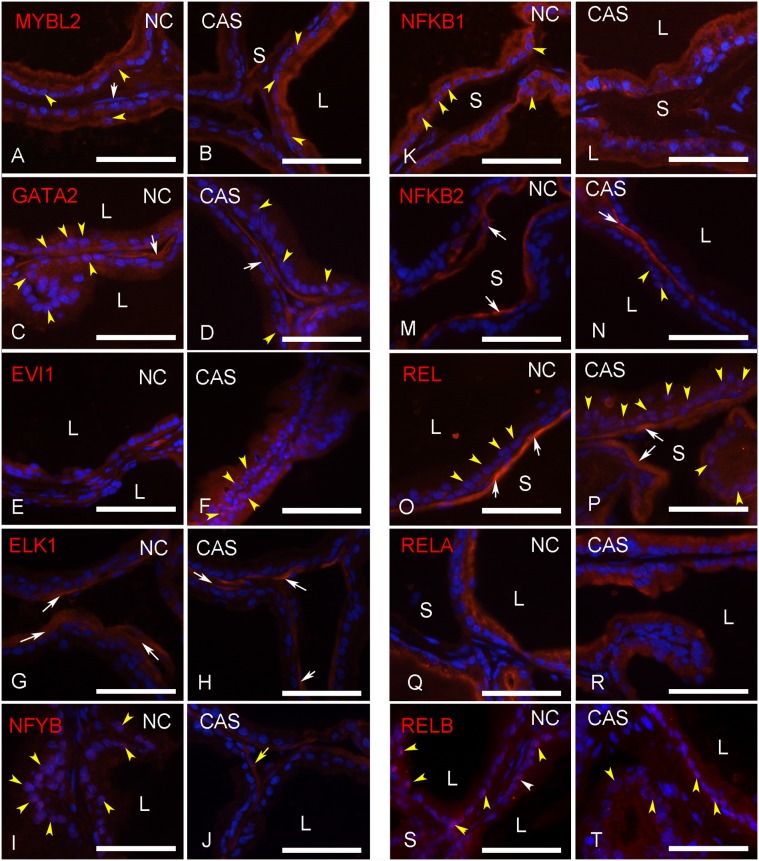
Figure 9. TF localization in epithelial and stroma cells.
Immunohistochemical localization of selected TF (red) as indicated in the prostate of non-castrated controls (NC) and castrated rats 3 days after surgery (CAS). MYBL2 (A,B), GATA2 (C,D), EVI1 (E,F), ELK1 (G,H), NFYB (I,J), NFKB1 (K,L), NFKB2 (M,N), REL (O,P), RELA (Q,R), RELB (S,T). Nuclei were stained with DAPI (blue). White arrows indicate smooth-muscle cells. Yellow arrowheads indicate cells showing nuclear location of the TF. L = gland lumen; S = stroma. Scale bars = 50 µm.

