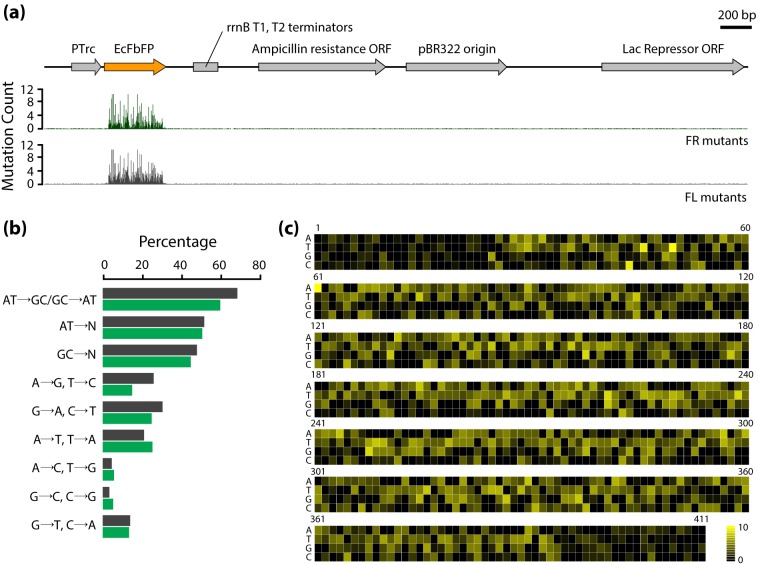
Figure 2. Sequencing results of FR and FL variants.
(a) Mapping of the mutation frequency in the whole pTrcHis2CEcFbFP vector. (b) Mutational spectra of induced mutations for each position and each nucleotide is indicated by the black bar. Blue bar indicates the mutational spectra obtained using the mutagenesis kit. (c) Map of the mutation frequencies in EcFbFP at DNA level. Mutations with frequency are shown in yellow.

