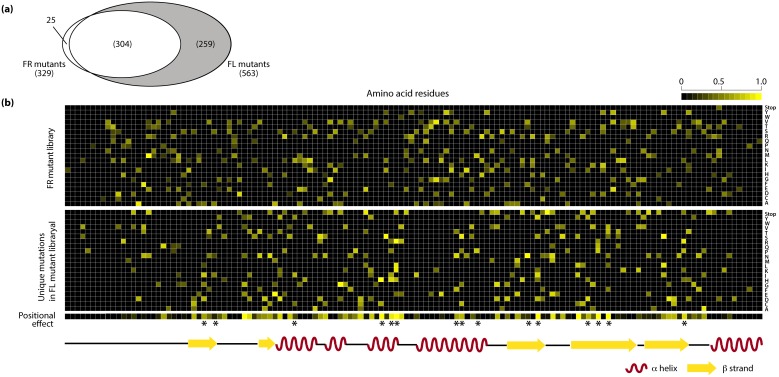
Figure 3. Critical residues determined by mutation frequency.
(a) Common and unique mutations in the FL library and FR library. (b) Heatmap of the positions of unique mutations of the FR and FL library with mutation frequency drawn on a scale of 0 to 1. Positions with enriched mutations are shown in yellow. The positional effect bar shows the residues with enriched FL mutations in yellow and residues with enriched FR mutations in black. The asterisks indicate known FMN-binding sites.

