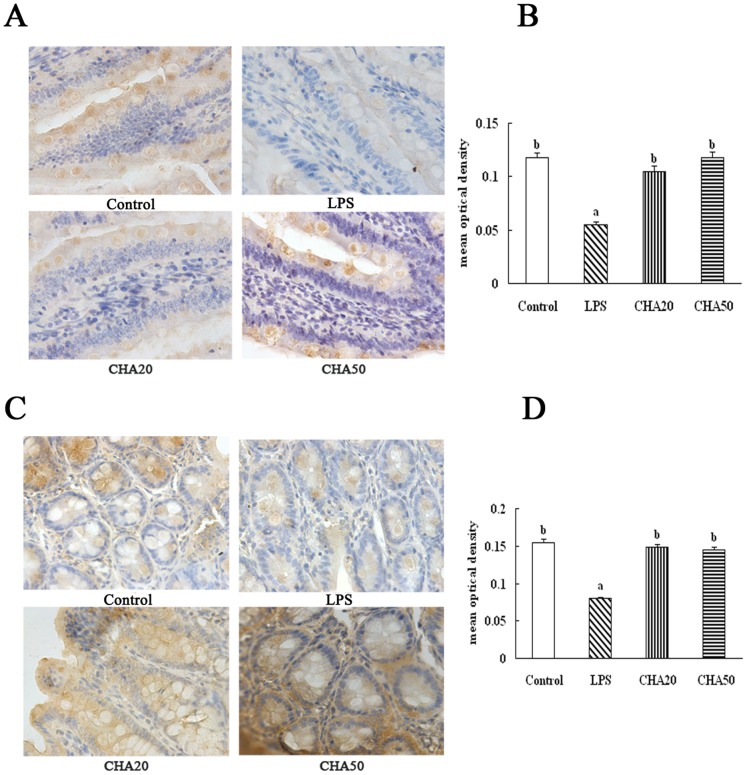
Figure 5. Effects of CHA on ZO-1 in the jejunum and colon of weaned rats.
ZO-1 protein in intestinal tissues was measured by immunohistochemical method. ZO-1 positive cells were stained in brown and present on the cell membrane. The bigger brown and deeper color represents the higher ZO-1 protein level. A, representative figures of ZO-1 in the jejunum. B, mean optical density of ZO-1 in the jejunum. C, representative figures of ZO-1 in the colon. D, mean optical density of ZO-1 in the colon. All pictures are shown at the 400× magnification. Significant differences (P<0.05) are identified by different letters a, b and c.

