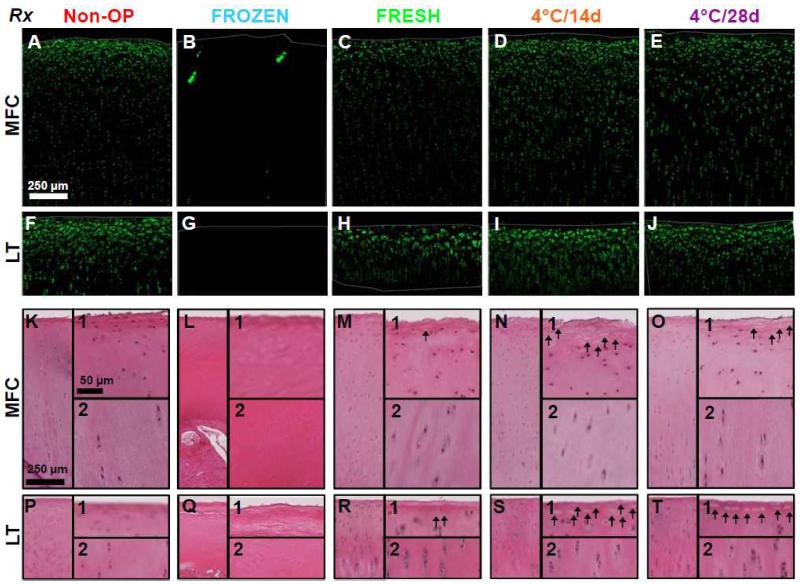
Figure 2.
Qualitative cellularity analysis in retrieved allografts. Representative (A-J) confocal and (K-T) H&E histology images of vertical profile view throughout the depth of articular cartilage of retrieved osteochondral allografts at (A-E,K-O) MFC and (F-J,P-T) LT sites after 12months in vivo. H&E histology images depict the full-profile and zoomed regions of the (1) surface, and (2) deep zone. Thin gray lines denote the cartilage surfaces. Arrows indicate empty cellular lacunae.

