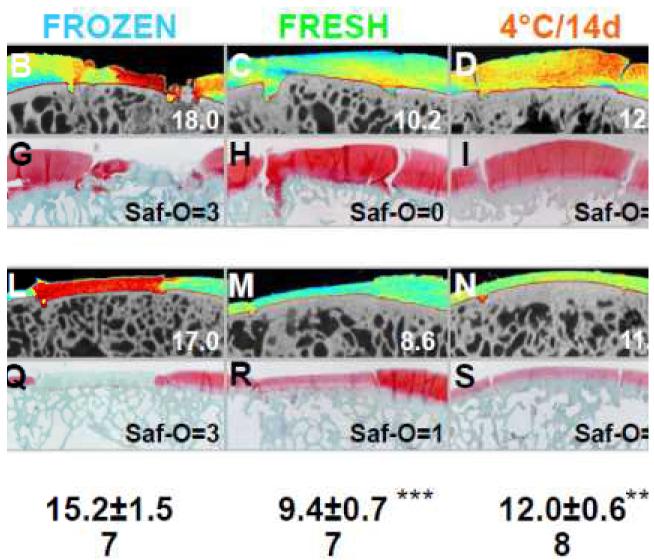
Figure 4.
Analysis of matrix fixed charge in retrieved allografts. Representative (A-E,K-O) color maps of HE-μCT analysis and corresponding (F-J,P-T) Safranin-O histology of retrieved osteochondral allografts at (A-J) MFC and (K-T) LT sites after 12months in vivo. Values in lower right corner correspond to the HE-μCT value or Safranin-O score of the representative image. Mean±SEM. **p<0.01, ***p<0.001 vs. FROZEN.

