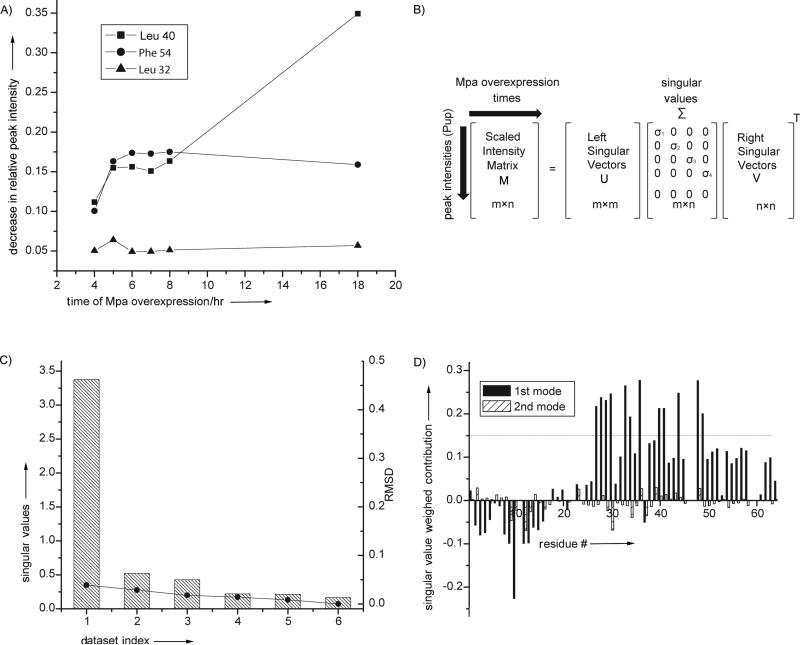
Figure 1. SVD analysis of in-cell protein-protein interactions.
A). The intensity of individual cross peaks of Pup change at different rates during interactor protein over-expression, Mpa. SVD analysis evaluates the magnitude of the contribution of an intensity change to the NMR data over the experimental time course to identify MPA concentration-dependent interactions. B). SVD of the experimental data matrix M of size m x n yields the matrices U, Σ, and VT,[5a] with sizes m × m, m × n, and n × n, respectively, where m is the number of target protein amino acid residues used in the NMR analysis, n is the number of time course NMR datasets, and VT is the transpose of matrix V. C). The Scree plot shows the distribution of singular values for each dataset index (binding mode) from 1 to 6. The root mean square deviation, RMSD, values between respective components and the complete dataset are indicated by solid circles. D). The weighted contribution of each Pup amino acid residue to the Mpa principal binding modes, calculated as a product of a corresponding singular value and left singular vector (see Experimental Section), is shown for the 1st (black) and 2nd (hatched) binding modes. The threshold of 0.14 is chosen to highlight the 12 amino acids that exhibit the largest singular value weighted. Negative values are due to spectral overlap between the target protein and cellular metabolites.

