
Figure 8.
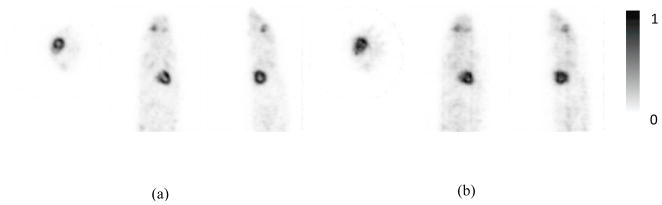
Images of a mouse acquired using the prototype PET scanner. Transverse, coronal, and sagittal slices are shown from left to right in each panel for images reconstructed (a) with and (b) without DOI. Total 16 subsets and 4 iterations were used in the OSEM image reconstructions.