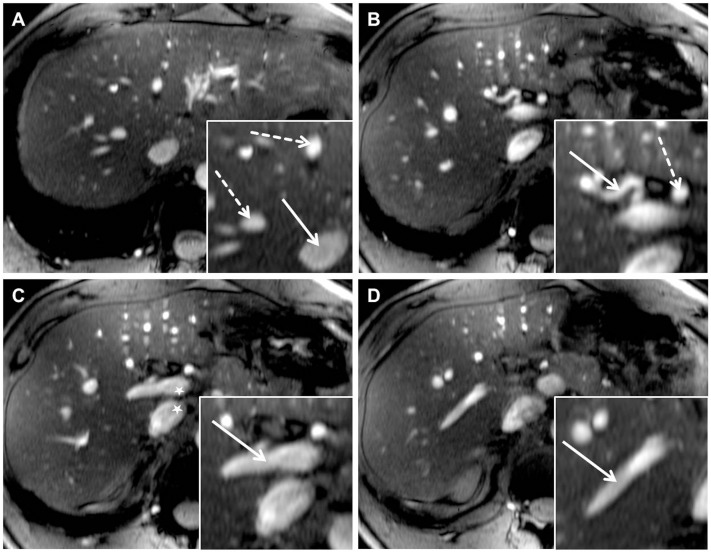
Figure 4. TOF MRA demonstrated high quality delineation of all analyzed liver vessel segments due to a hyperintensive vessel signal and an effective suppression of background signal.
Figure A shows the inferior vena cava (arrow) as well as the right and middle hepatic veins (dashed arrow). A major part of the right hepatic artery (arrow) and a section of the common hepatic artery (dashed arrow) are visualized in Figure B. Figure C and D show the hyperintense delineation of the main portal vein (arrow) and the right portal vein (arrow). A slight intraluminal signal inhomogeneity could be depicted in the main portal vein and inferior vena cava (Figure C, star). Furthermore, signal drop outs due to susceptibility are visible in the stomach in the left ventral abdomen, but do not hamper vessel visualization (Figure B–D).

