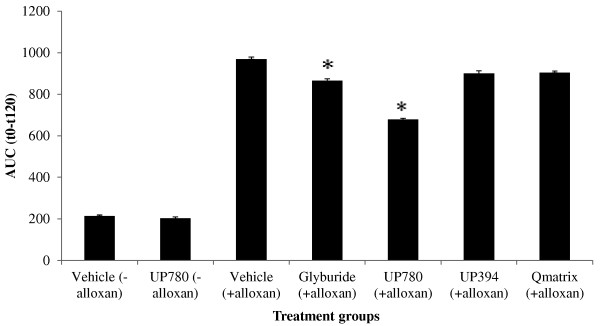
Figure 3.

Area-under-concentration curve value of glucose in oral glucose tolerance test (AUC (t0-t120)). Oral glucose tolerance test (OGTT) was conducted 4-week after onset of treatment. On the test day, animals (N = 15/group) were fasted for 5 hours and received oral administration of glucose at a dose of 2 g/kg. Blood glucose levels were determined at time 0 (before glucose injection), and at 30, 60, 90, and 120 minutes post glucose delivery. Blood samples were obtained from the tail. Data are expressed as mean ± SD. A conventional trapezoid rule was used to determine area under the curve (AUCt0-120) for glucose tolerance test. * P ≤ 0.05.
