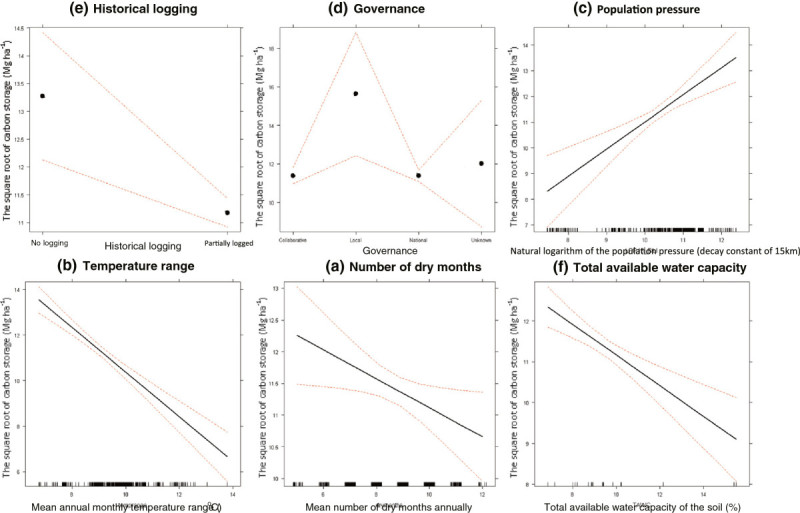
Figure 4.

The modelled effect of most influential, significant anthropogenic (a, b, and c), climatic (d and e) and edaphic (f) variables of aboveground live carbon storage. Dashed red lines indicate the modelled 95% CI. The data is indicated by black lines above the x-axis.
