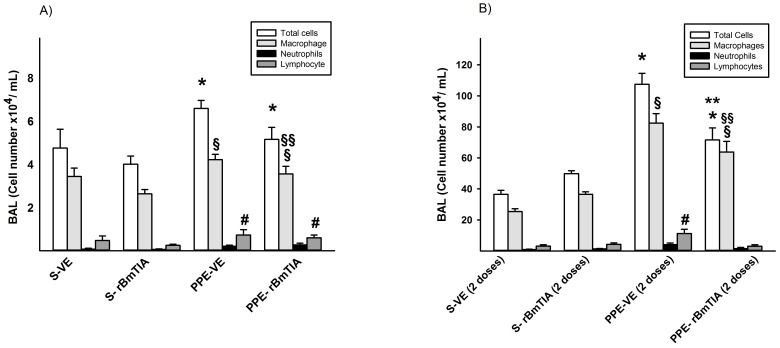
Figure 2. BALF analyses in the first and second protocols are shown in figures 2A and B, respectively.
A) Total Cells: * p = 0.02 compared to S groups; Macrophages: § p = 0.02 compared to S groups and §§ p = 0.004 compared to PPE-VE; Lymphocytes: # p = 0.03 compared to S groups. B) Total Cells: * p≤0.01 compared to S groups and ** p≤0.01 compared to PPE-VE group; Macrophages: § p = 0.05 compared to S Groups and §§ p = 0.013 compared to PPE-VE group; Lymphocytes: #p≤0.01 compared to the other groups. Values are means and SD.

