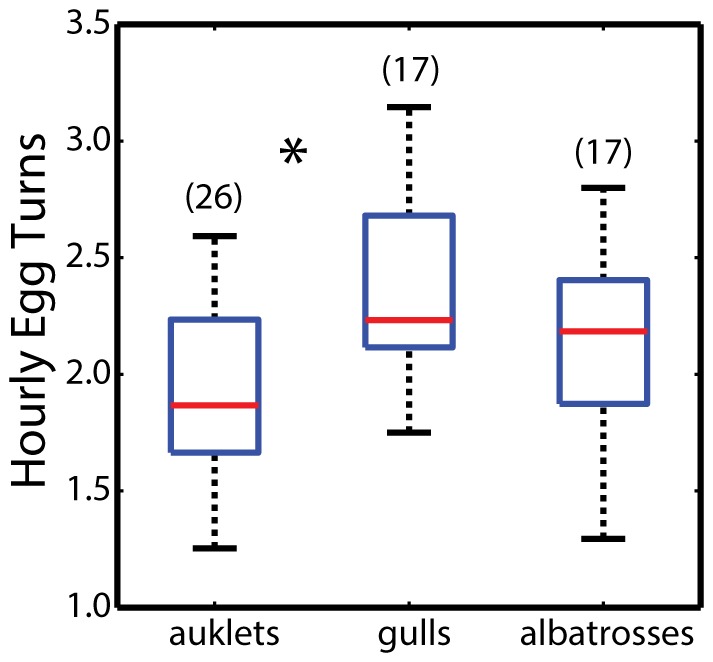
Figure 3. Summary of egg movements in Cassin's auklets, western gulls, and Laysan albatrosses.
Shown are box & whisker plots representing the median values (red lines), upper and lower quartiles, upper and lower extremes for all individuals of a particular species, and the dot is an outlier. Sample sizes of individual deployments for each species are enclosed in (). Albatross deployments included a mixture of single deployments (N = 10 nests) and repeated deployments (N = 5) in the same nest. Statistical differences (ANOVA and pairwise comparisons) among species are denoted by asterisks. Turning rates were based on a minimum threshold of 10° of angular change in egg orientation to be counted as part of the rate (see Figure 4 for additional detail).

