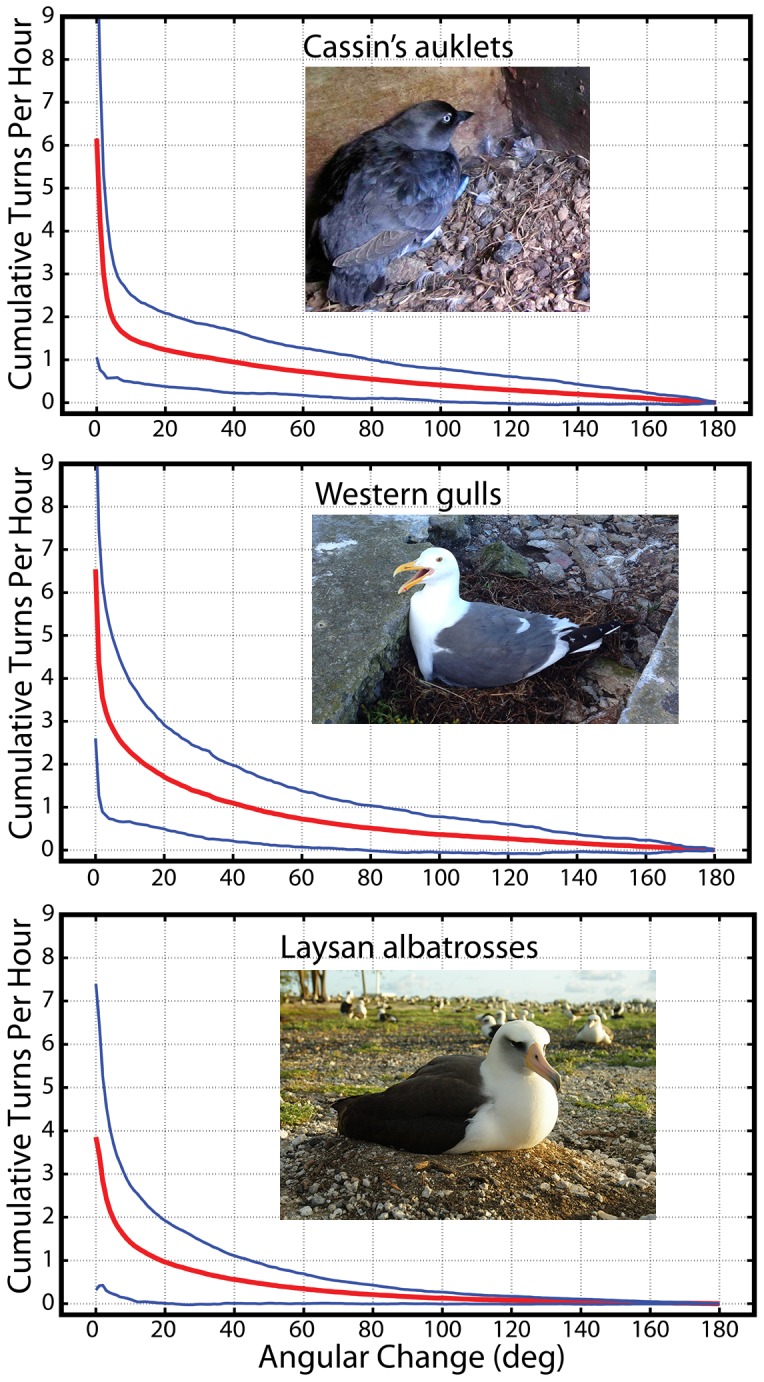
Figure 4. Cumulative turns h−1 as a function of turn angle for each species.

Plotted are the means (red line) and confidence intervals (blue lines) for each species. These plots show that a preponderance of small changes in egg orientation leads to a high rate of egg turning and vice versa. Angular change is based on the combination of all three attitudes (roll, pitch, and yaw) determined using Euler's theorem (see Figure S2 and File S1). Turning rates shown in Figures 2 & 3 were estimated using a minimum threshold of 10° of angular change to be counted as a turning event. Without using a minimum threshold, turning events ranged between 5–8 turns per hour for each species and these were largely (>95% of all angle changes) based on changes of 1–2°. Photos by ECK and SAS.
