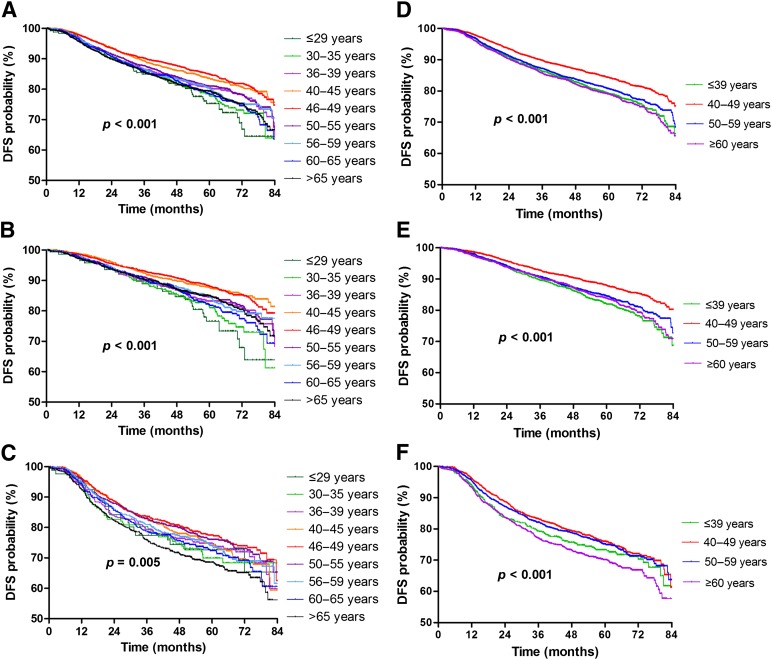
Figure 2.
DFS curves: whole population (A); patients with ER-positive tumors (B) and ER-negative tumors (C) by the nine age groups and in the whole population (D); patients with ER-positive tumors (E) and ER-negative tumors (F) by the four age groups (unadjusted analysis).
Abbreviation: DFS, disease-free survival.

