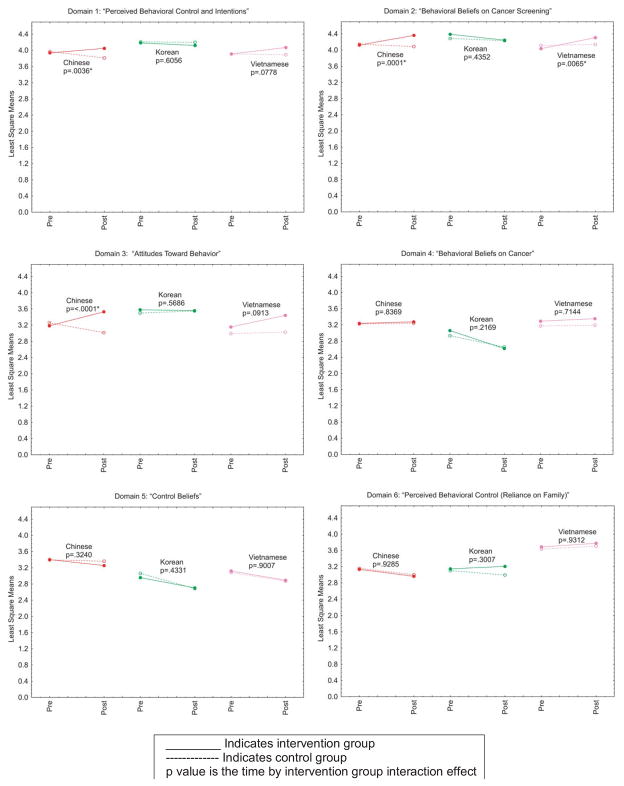
Figure 1. Differences in Least Square Means of each Domain According to Study Group and Asian Subgroup.
This interaction plot displays the least square means of the domain scores at baseline and post-intervention according to both study group assignment and Asian subgroup. The p values reflect whether pre- vs. post-intervention change was significantly different between two study groups.
––––– Intervention group ------ Control group

