
Fig. 3.
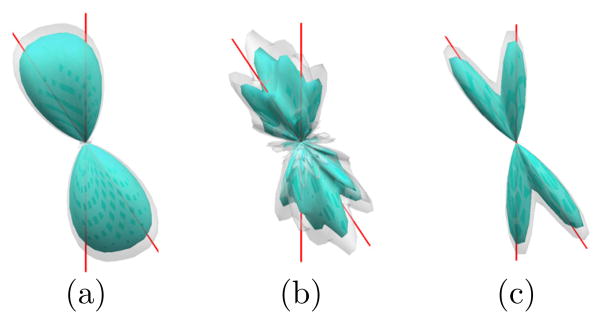
A comparison of 100 runs of FOD reconstruction results from simulated diffusion data. The cyan surface is the mean FOD and the shaded surface is mean plus two standard deviation of the FOD from 100 runs. Red lines indicate true fiber directions. (a) Method in [9]: L = 8. (b) Method in [9]: L = 16. (c) Our method: L = 16.