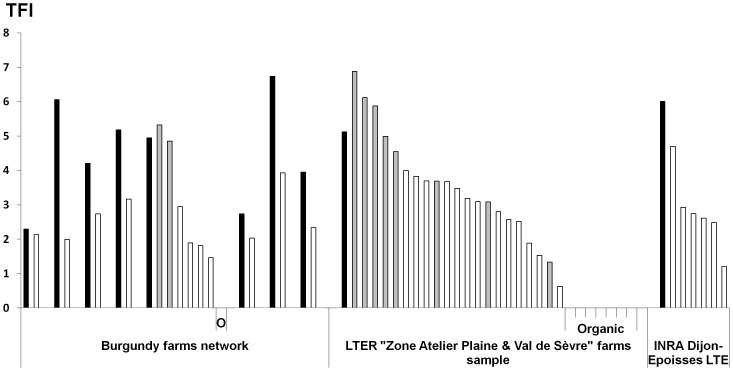
Figure 1. Distribution of the Treatment Frequency Index (TFI) for the studied arable cropping systems.
Average TFI for each cropping system composing the study sample. At each site, black bars correspond to the local reference, grey bars to conventional cropping systems and white bars to integrated cropping systems. The sample also includes eight organic cropping systems with TFI = 0 and labelled with “O” or “Organic”. Details about the cropping systems are available in Dataset S1.

