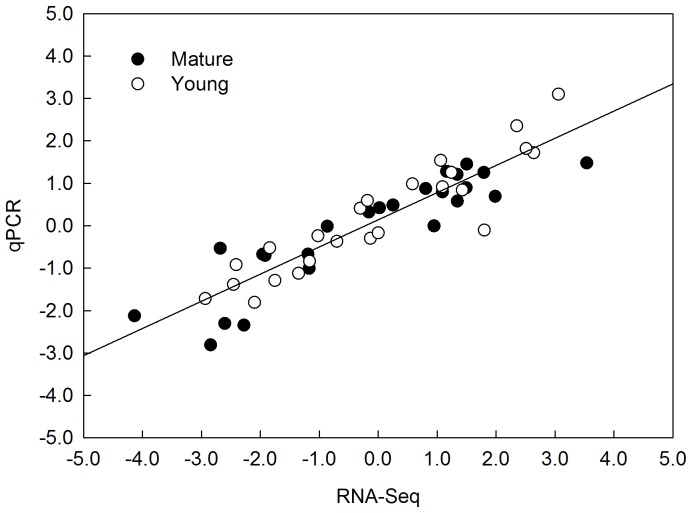
Figure 1. Correlation between the RNA-Seq and qRT-PCR data on identified differentially transcribed genes.
Data are log2FC values from RNA-Seq and qPCR analyses. 24 genes were randomly selected for comparison between RNA-Seq and qRT-PCR. Filled circles represent data in mature leaves, open circles represent data in young leaves. The overall Spearman correlation of mature and young leaves is 0.910 (p<0.001).

