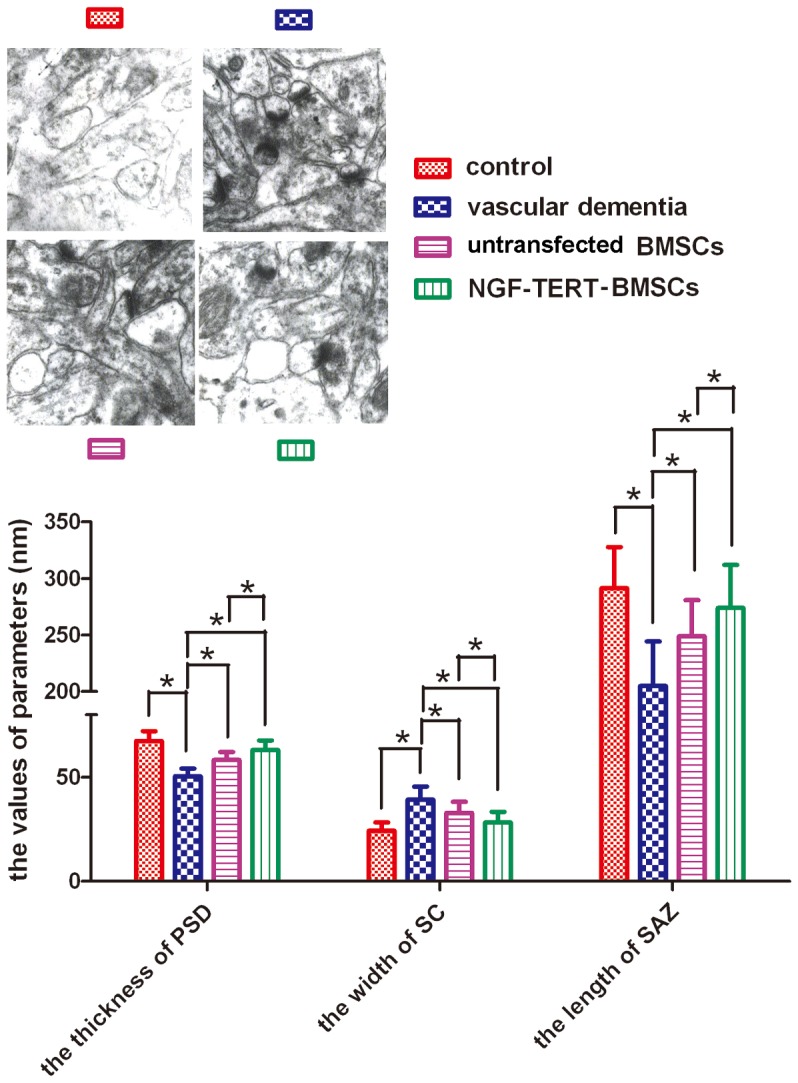
Figure 7. Ultrastructure in the hippocampal CA1 area by transmission electron microscopy (×40,000).

The synaptic structural parameters of the hippocampal CA1 area in each group are shown. PSD, postsynaptic density; SC, synaptic cleft; SAZ, synaptic active zone. (*P<0.05, n = 12).
