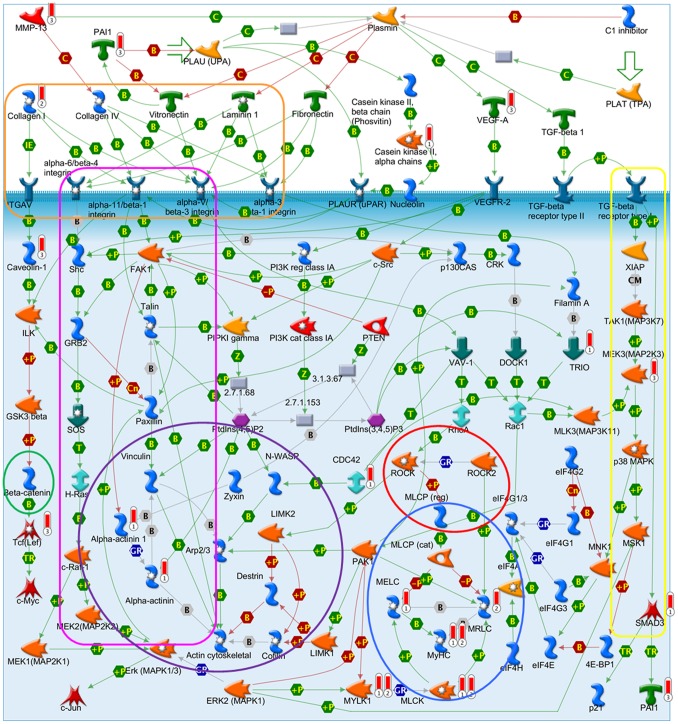
Figure 5. GeneGo pathway “Cytoskeleton remodeling”.
Barometer: 1 = 0.01 gene list; 2 = general metastasis signature; 3 = brain metastasis signature. orange = ECM-receptor interaction, purple = Adherens junction pathway, red = Calcium signaling pathway, pink = Focal adhesion pathway, yellow = TGF-β signaling pathway, green = Wnt signaling pathway, blue = Smooth muscle contraction/relaxation.

