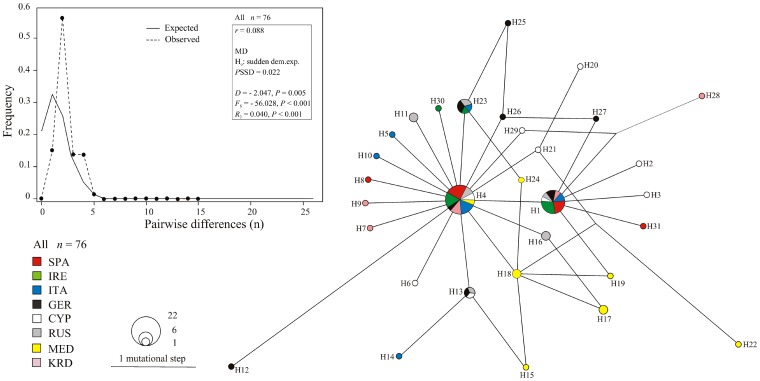
Figure 2. Median-Joining network of barn swallow populations computed on mtDNA haplotypes with network.
Size of circles is proportional to the haplotype frequency. The colour of each population is indicated as well as the number of each haplotype. A length bar to compute the number of mutational changes was provided (see also Table S1). The inset showed Mismatch Distribution (MD) of the mtDNA pairwise differences (observed: dotted; expected: line) computed on the whole dataset (n = 76). The expected curve was obtained from simulated values computed from the data under the model of demographic expansion (H0). The Harpending's raggedness index (r) was given with the P value of the SSD test as well as Tajima's D, Fu's F S and R 2 statistics.

