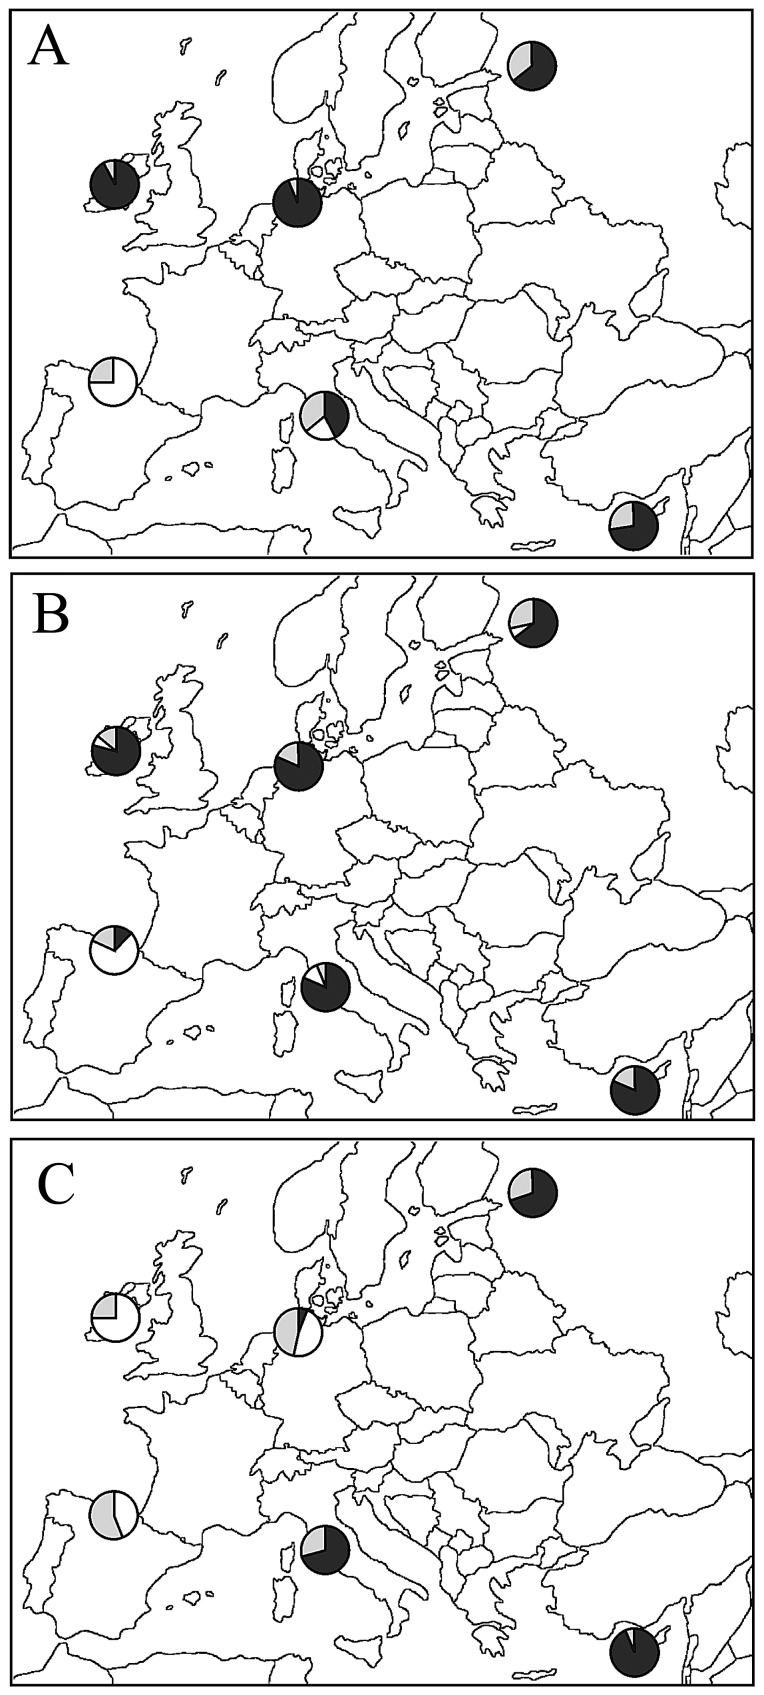
Figure 4. Bayesian admixture analysis as inferred using structure.
The ΔK calculated according to Evanno et al. [61] was optimal for K = 2 in all computations. Each population was represented by a pie chart whose segments were proportional to the number of specimens assigned to cluster I (black), to cluster II (white) or which showed admixed genotypes (grey). Threshold value for assignment to each cluster was Qi = 0.80 (Table S4). (A) All individuals. (B) Only males. (C) Only females.

