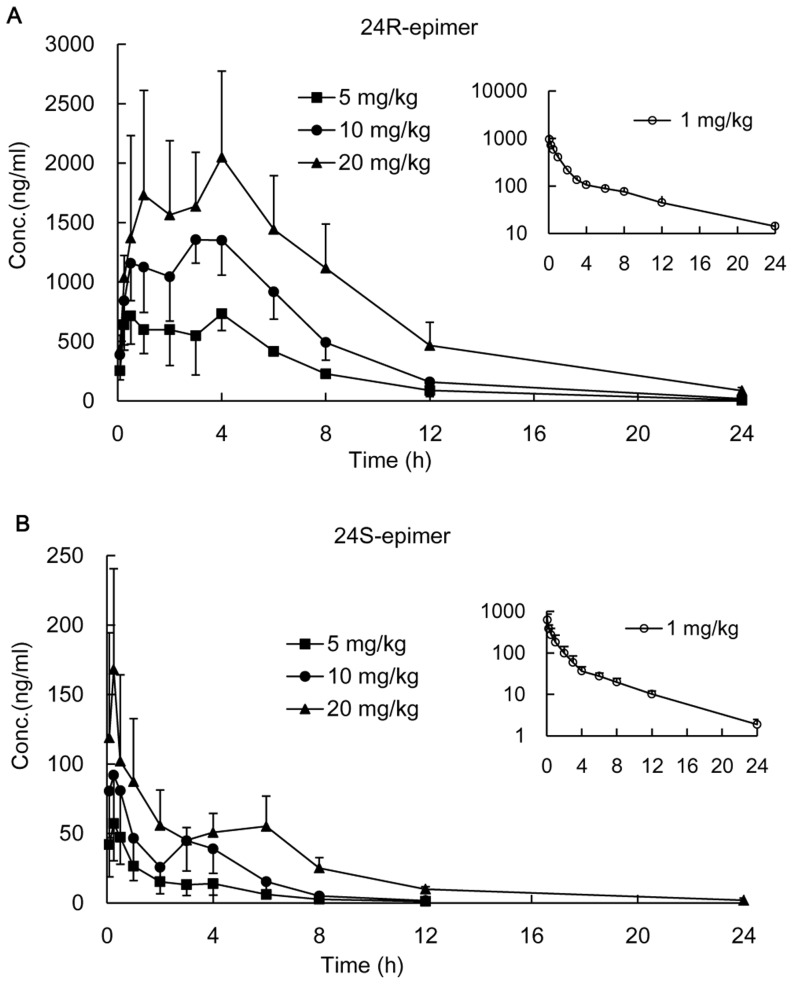
Figure 2. Plasma concentration-time profiles of 24R-epimer and 24S-epimer in rats.
The intragastric administration groups were administered 24R-epimer (A) or 24S-epimer (B) at doses of 5, 10 and 20 mg/kg, respectively. The intravenous groups were presented in smaller figure administered 1 mg/kg of 24R-epimer or 24S-epimer, respectively. n = 5 per group.

