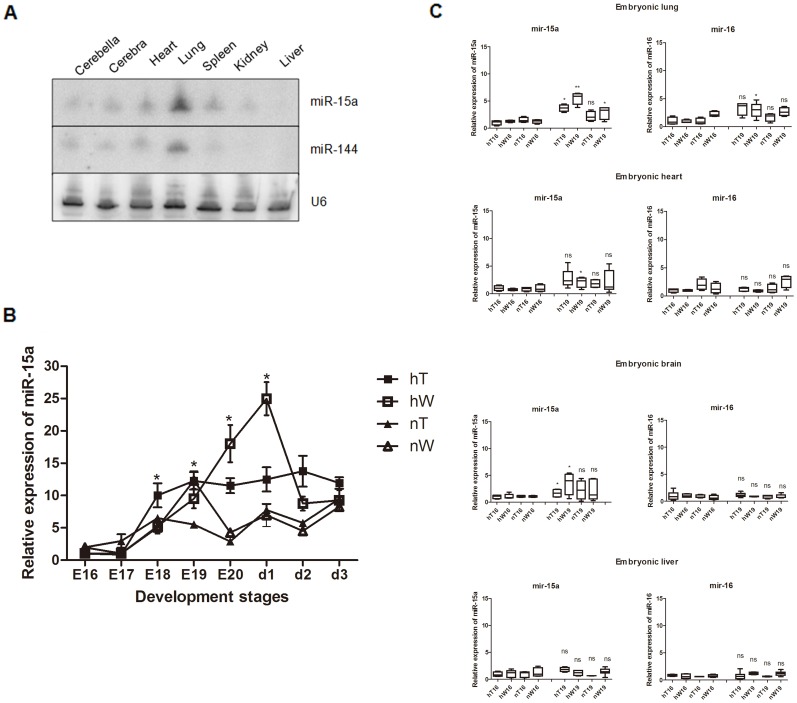
Figure 1. Expression of miRNAs in chicken lung tissues.
(A) Total RNA from tissues from E19 chicken embryos was blotted with probes for miR-15a, miR-144 and U6 (loading control). miR-15a and miR-144 were identified in late-stage embryonic lung tissue. In each sample, the total RNA was mixed with samples from 9 chickens. (B) Quantitative expression analysis of miR-15a showed hypoxia-related expression that was affected by both the species and environmental conditions. The hW chicken group was most sensitive relative to other three groups. In the nW chicken group, there was a response at E19. At E19 of the nW chicken group, the expression of miR-15a remained relatively high in the hT chicken group compared with the nT, nW chicken groups and was largely unchanged in the nT chicken group through the whole embryo stages. Data are expressed as the mean ± SEM for each group. (C) Quantitative expression analysis of miR-15a and miR-16 in the embryonic lung, heart, brain and liver at E16 and E19 tissues and were expressed as the mean ± SEM for each group. Under hypoxia stress, miR-15a was more highly expressed at E19 than at E16 in the brain, heart and lung for the hW group and in the lung and brain for the hT group. miR-16 showed a weak response to stress in the embryonic lung (hW). Result statistically different are indicated with an asterisk/s (* P<0.05; ** P<0.01; ns : not significant). E16-20 = embryonic d13-20, respectively. d1, d2, d3 = the 1st day after hatching, the 2nd day after hatching, the 3rd day after hatching.

