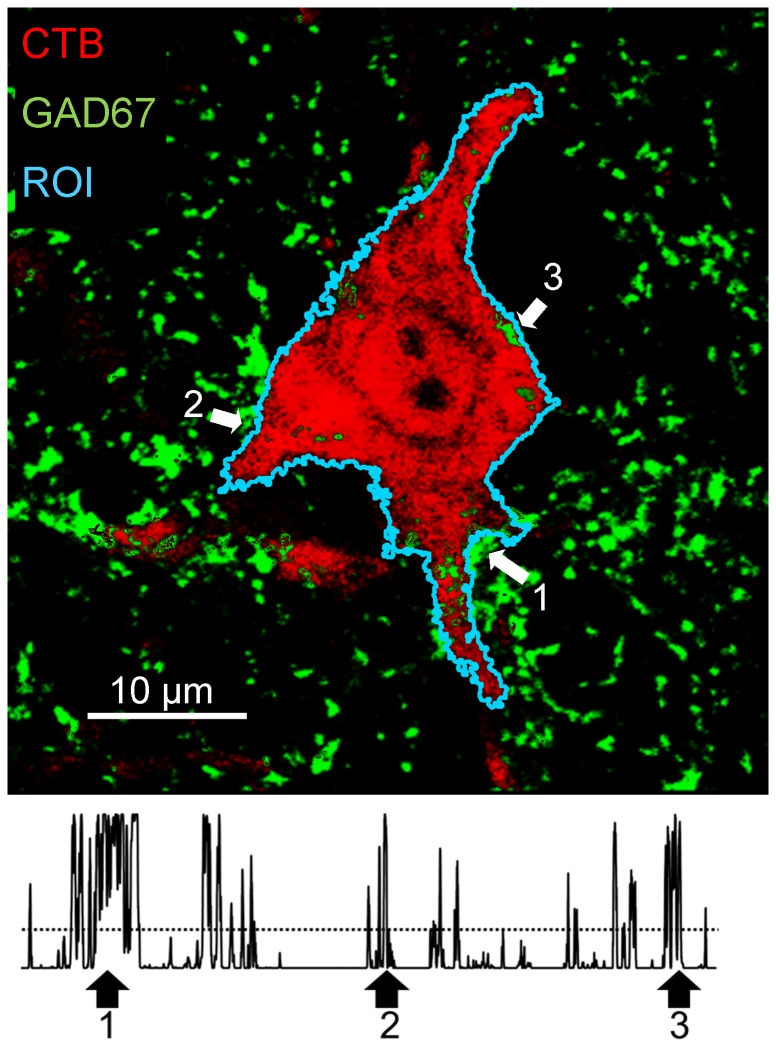
Figure 1. A single retrogradely labeled motoneuron (red) is shown to demonstrate the measurements made throughout this study.
This image is from a histological section reacted with an antibody to glutamic acid decarboxylase 67 (GAD67, green). A region of interest (ROI) around the perimeter of this profile of the motoneuron visible in this confocal image was created (cyan line) and the green fluorescence intensity was measured beneath the ROI. In the resulting plot profile (bottom), a threshold intensity (horizontal dashed line) was established, based on the red intensity within the ROI. Intensity values above this threshold were assumed to represent contacts of the motoneuron soma and structures immunoreactive for synapse-specific antigens. Arrows are placed at three examples of the several clusters of contacts in the image and the corresponding position of the plot profile.

