
Figure 3. Time to relapse.
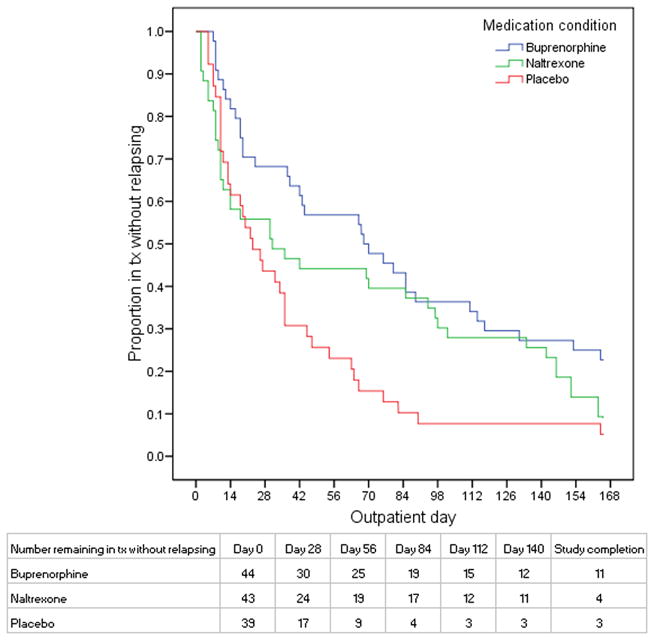
Figure 3 shows the proportion of enrolled patients in each treatment group on each study day following detoxification who were remaining in treatment and had not relapsed
Official websites use .gov
A
.gov website belongs to an official
government organization in the United States.
Secure .gov websites use HTTPS
A lock (
) or https:// means you've safely
connected to the .gov website. Share sensitive
information only on official, secure websites.
Figure 3 shows the proportion of enrolled patients in each treatment group on each study day following detoxification who were remaining in treatment and had not relapsed