Abstract
Alzheimer's disease (AD) and Mild Cognitive Impairment (MCI) are characterized by widespread pathological changes in the brain. At the same time, Alzheimer's disease is heritable with complex genetic underpinnings that may influence the timing of the related pathological changes in the brain and can affect the progression from MCI to AD. In this paper, we present a multivariate imaging genetics approach for prediction of conversion to Alzheimer's disease in patients with mild cognitive impairment. We employ multivariate pattern recognition approaches to obtain neuroimaging and polygenic discriminators between the healthy individuals and AD patients. We then design, in a linear manner, a composite imaging-genetic score for prediction of conversion to Alzheimer's disease in patients with mild cognitive impairment. We apply our approach within the Alzheimer's Disease Neuroimaging Initiative and show that the integration of polygenic and neuroimaging information improves prediction of conversion to AD.
Keywords: imaging genetics, multivariate analysis, pattern classification, Alzheimer's disease, mild cognitive impairment
I. Introduction
Alzheimer's disease (AD) and its prodromal stage Mild Cognitive Impairment (MCI) are characterized by widespread pathological changes in the brain and present a growing health problem. Early identification and prediction of AD is crucial for our ability to intervene in the disease process with any success. As a result, much effort has been devoted toward the development of computational predictive tools that could potentially facilitate the prediction of AD. Image-based high-dimensional pattern classification has gained significant attention in recent years, and has been found to be a promising technique for capturing complex spatial patterns of pathological brain changes associated with AD and MCI [1], [2], [3].
At the same time, AD appears to be highly heritable with the complex genetic factors affecting the timing of the disease [4]. Unfortunately, the predictive ability of individual genetic risk factors is low. In particular, the best established genetic factor ε4 allele of Apoliprotein E (APOE) [5] has been shown to be absent in 35%-50% patients with AD. Moreover, others common DNA variants associated with AD that have much weaker individual effects than the APOE-ε4 have been established. However, despite the individually weaker than the APOE-ε4 effects, analytic polygenic markers computed from non-APOE common sequence variants have been shown to be associated with brain pathology [6].
Several attempts have been made recently in the direction of integrating different types of imaging and genetic information for pattern classification in the studies of aging and Alzheimer's disease. Zhang et al. [7] integrated multimodal imaging and non-imaging (i.e., APOE) via a weighted combination of multiple kernels, which provided improvements in the problem of discriminating Alzheimer's disease (AD) (or Mild Cognitive Impairment (MCI)) and healthy controls. Similarly, a kernel-based approach to integrating imaging and APOE information in the context of predicting AD has been developed in [8]. However, despite the growing evidence about the polygenic nature of AD and the strong relationship between the genetic profile and neuronal changes, little attention has been paid to developing computational tools that incorporate neuroimaging and multiple candidate single-nucleotide polymorphisms (SNPs) to predict conversion to AD.
In this paper, we present a multivariate imaging genetics approach for prediction of Alzheimer's disease in patients with mild cognitive impairment. We employ a multivariate pattern recognition approach to obtain a neuroimaging discriminator between the healthy individuals and AD patients. We also create a multivariate polygenic discriminator of AD and control populations. We then integrate the neuroimaging and polygenic discriminators within a linear model to build a composite imaging-genetic predictor of conversion from MCI to AD. We apply our approach within the Alzheimer's Disease Neuroimaging Initiative (ADNI, www.loni.ucla.edu/ADNI) and show that the integration of polygenic and neuroimaging information improves the accuracy of identifying MCI patients who will convert to AD. Our results suggest that the AD-discriminative polygenic pattern is particularly informative for prediction of AD in relatively older cognitively well-performing individuals.
II. Method
A. Imaging information
In order to design the imaging-genetic predictor of AD conversion, we used the structural imaging and the genetic information in of ADNI. We focused on the baseline structural MRI evaluations obtained for 129 controls, 125 AD patients, 105 MCI converters (MCI-C), and 169 MCI non-converters (MCI-Nc). MR images were preprocessed following mass-preserving shape transformation framework [9]. Each skull-stripped MR brain image was first segmented into gray matter (GM), white matter (WM), and cerebrospinal fluid (CSF), by a brain tissue segmentation method proposed in [10]. Afterwards, each tissue-segmented brain image was spatially normalized into a template space, by using a highdimensional image warping method [11]. The total tissue mass is preserved in each region during the image warping, which is achieved by increasing the respective density when a region is compressed, and vice versa. Tissue density maps were generated in the template space, reflecting local volumetric measurements corresponding to GM, WM and CSF.
B. Genetic information
A list of candidate single nucleotide polymorphisms (SNPs) associated with AD was acquired from the catalog of published genome-wide association studies (GWAS) (http://www.genome.gov/gwastudies), an online, regularly updated database of SNP-trait associations. The respective GWAS publications included only those attempting to assay at least 100,000 single nucleotide polymorphisms in the initial stage and the SNP-trait associations were limited to those with p-values < 1.0 × 10⁻⁵. In cases a SNP was not found in the ADNI database, whenever possible, we selected a SNP from ADNI that was in high linkage disequilibrium with the given SNP. As the result of the candidate variate selection we obtained 42 SNPs. Additionally, we included APOE-ε4, resulting in a total of 43 genetic variants. Each SNP was represented by one of the following binary triplets, with (1,0,0) and (0,0,1) indicating the homozygosity of one of the two alleles, and (0,1,0) indicating the heterozygous case. Notice, that our representation differs from the commonly used representation where a SNP is represented by a single value (e.g., 0, 1 or 2), and, therefore, does not assume invremental effects due to the allelic zygosity. In the case of APOE-ε4, the absence, the heterozygous presence, and the homozygous presence of the allele were coded as (1, 0, 0), (0, 1, 0) and (0, 0, 1), respectively. As the result, after concatenating the binary triplet representations for the 43 variants, the genetic information for a given subject was represented with a 129-dimensional binary vector.
C. Classification
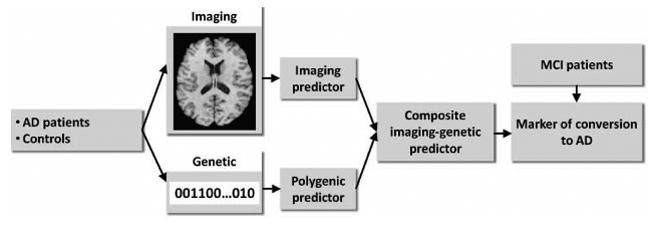
The overview of our approach is presented in Figure 1 and includes the following main components: 1) Estimation of a multivariate image-based discriminator between controls and AD patients; 2) Estimation of a multivariate polygenic discriminator between controls and AD patients; 3) Integration of the imaging and polygenic discriminators to derive an imaging-genetic marker of conversion to AD in MCI patients.
Figure 1.

Diagram of our approach.
1) Multivariate imaging marker of AD
Given the MRIs of the patients with AD and of the healthy subjects, our goal is to create an imaging marker that quantifies the presence of the AD-related phenotypic pattern in the brain. For this purpose we employed the nonlinear multivariate pattern recognition approach “COMPARE” [12], and detected volumetric patterns that are good discriminators between AD and healthy control populations. The detected patterns of volumetric regions were used to train a nonlinear Support Vector Machines (SVM) [13] classifier with a gaussian kernel, and to obtain an individualized classification-based score. For a given subject x, the score, i.e., the value of the classification function
 (x), quantifies the presence of AD-like pathology in the brain with positive values of the score indicating the presence of the AD-related pattern of brain structure.
2) Multivariate polygenic marker of AD
We used linear SVM to build a polygenic classifier between the controls and AD patients. The parameter of the linear SVM was estimated within a cross-validation. For a given subject x, the non-binarized value of the classification function
 (x) reflects the amount of the polygenic AD-related pattern in the subject's genotype, with larger positive values indicating a more pronounced pattern.
3) Integrated imaging-genetic marker of MCI conversion
Given a set of MCI subjects X = {x1, …,xm}, we obtain the respective values of the imaging and genetic prediction functions as and . The distributions of the imaging predictive values and genetic predictive values are normalized to be each of zero mean and unit variance. Given the k-th subject's imaging and polygenic predictive scores and , we represent the subject's composite imaging-genetic marker of AD as
| (1) |
where the weights βI and βG reflect our confidence in the imaging and genetic markers, respectively. Given the classification accuracy αI of the image-based classifier
 , and the classification accuracy αG of the genetic classifier
 estimated on the training set in the task of classifying AD and controls, the weights of the markers in the composite predictor are set as βI = 1 − αG and βG = 1 − αI. Notice, that instead of setting the coefficients βI and βG to be proportional to the accuracies of the respective classifiers in the AD/controls classification task, we weight the imaging score with respect to the misclassification error estimated for the genetic score, and vice versa. This choice is motivated by the fact that the accuracies of classifying AD and control populations can be relatively high (i.e., as much as 90% for image-based methods [2]), and it is preferable to compare different classifiers in terms of the misclassification error, rather than in terms of the classification accuracy.
III. Results
A. Prediction of conversion from MCI to AD
We estimated the accuracy of our approach in the task of identifying MCI converters in the MCI population. The area under the ROC curve (AUC) of the composite imaging-genetic score applied to the task of classifying MCI-C and MCI-Nc subjects was 0.708. In comparison, the accuracy of the imaging-based predictor was AUC = 0.687, and the accuracy of the polygenic predictor was AUC = 0.587.
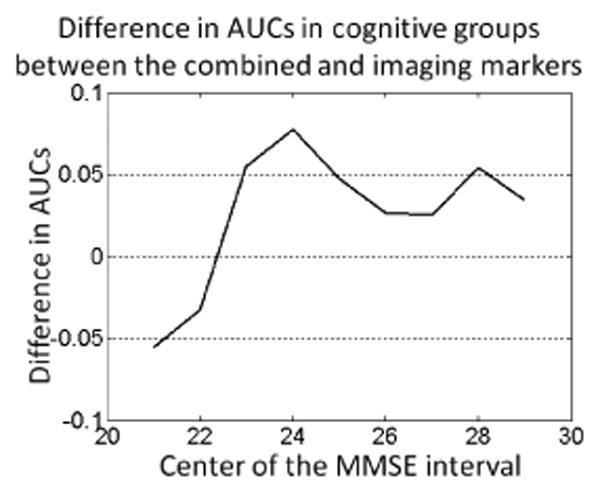
As the MCI is a heterogeneous condition, we analyzed the performance of the imaging-genetic marker in different groups formed with respect to the cognitive performance as assessed via the Mini-Mental State Examination (MMSE) [14]. For a specific MMSE performance we selected individuals whose MMSE score fell within the ±1 interval, and estimated the accuracies for the imaging-genetic and imaging-only markers in the selected subpopulations. The plot in Figure 2 shows the differences in the AUC between the two markers, with the positive values indicating higher AUC for the imaging-genetic marker. The plot suggest that for the cognitively better performing individuals, the performance of the imaging-genetic marker is superior to the performance of the marker that relies solely on the neuroimaging.
Figure 2.

Difference in AUCs obtained for the imaging-genetic and imaging-only markers for subjects within the specific MMSE range. The values on the horizontal axis denote the centers of the ±1 MMSE intervals. Positive values in the plot indicate superior performance of the imaging-genetic marker.
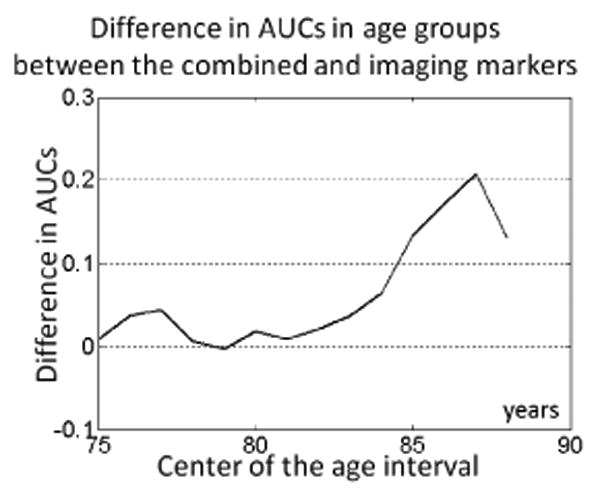
Similarly, we estimated the accuracy of the marker in different age subgroups of the MCI population. The plot in Figure 3 shows the differences in the AUCs between the two markers estimated for the subpopulations that fell within a ±3 years intervals of the specific ages. Contrary to what could be initially expected, the plot suggests that the genetic marker as estimated on the AD and control populations does not always provide improvement upon neuroimaging for relatively younger subjects if considered within our linear model. In contrast, noticeable improvement associated with the added value of genetic information was achieved for relatively older individuals. It has to be mentioned that there was no correlation between age and MMSE in the MCI population (r = −0.02).
Figure 3.

Difference in AUCs obtained for the imaging-genetic and imaging-only markers for subjects within the specific age range. The values on the horizontal axis denote the centers of the ±3 years interval. Positive values in the plot indicate superior performance of the imaging-genetic marker.
Finally, we identified relatively older individuals with relatively high cognitive performance. We analyzed the prediction accuracy for MCI subjects 80 years and older who achieved at least 20 out of 30 points in the MMSE. The accuracy of the imaging-only marker for the older cognitively moderate-to-well performing subpopulation was AUC = 0.746. At the same time, the accuracy of the imaging-genetic marker was noticeably higher (AUC = 0.779).
B. Imaging and genetic patterns of AD
In order to further understand the behavior of the predictor, we analyzed the individual imaging and genetic patterns estimated by the pattern classification approaches. The training stage of the image-based classification approach [12] performs ranking of the volumetric regions and selects the the subset of regions that yields highest classification accuracy. By calculating the number of times a given voxel was included into the top-ranked volumetric regions during leave-one-out evaluation in the training stage, it is possible to visualize regions that were consistently used to build patterns discriminative of AD (see [12] for details).
On the other hand, the linear SVM classifier used by us to derive the polygenic marker has the form
 (x) = w·x+b, where b is the offset of the separating hyperplane from the origin in input space, and the weights w determine the hyperplane's orientation. Importantly, the relative importance of the features is indicated by the absolute values of w. Recall that in our representation a SNP is represented by three features, and each genetic feature corresponds to the absence, the heterozygous presence, or the homozygous presence of an allele.
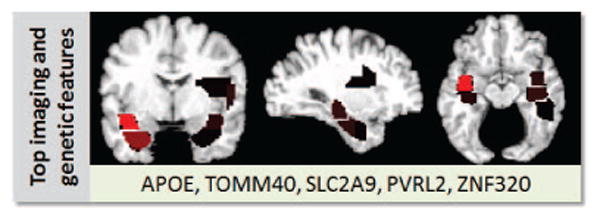
Figure 4 shows the imaging end genetic patterns that most affect the individual imaging and genetic markers. The spatial pattern of AD-related pathology in the brain included hippocampal and temporal regions. At the same time, to represent the genetic pattern affecting the discrimination between AD and controls, we identified ten genetic features that were most important for the genetic AD/controls classifier. The top ten genetic features represented aspects of allelic zygosity and dominance of five different SNPs. In particular, all three features corresponding to the APOE-ε4 were present among the top ten genetic features. Figure 4 lists the genes that contain (or are close to) the SNPs whose features have large effect on the genetic classifier. In particular, the features representing a SNP in TOMM40, a gene that is closely adjacent to APOE, were also among the features affecting the genetic classifier.
Figure 4.

Imaging and genetic patterns estimated individually by the imaging and genetic classifiers. Genetic features are represented by the genes that contain (or are close to) the SNPs that have the largest effect on the genetic classifier.
IV. Conclusion
In this paper, we presented a multivariate imaging genetics approach for prediction of Alzheimer's disease in patients with mild cognitive impairment. By combining the outputs of the polygenic and neuroimaging classifiers within a linear model, we showed that the genetic information provides additive value in the task of predicting the conversion to AD. Our analysis suggests that the polygenic pattern discriminating between AD patients and controls can improve prediction, particularly in the cognitively moderately-to-well performing individuals above 80 years. Additional longitudinal analysis would allow to further assess the relationship between the imaging and genetic predictors of AD. Derivation of imaging-genetic markers directly from the MCI population is also an interesting avenue for future research.
References
- 1.Duchesne S, Bocti C, De Sousa K, Frisoni GB, Chertkow H, Collins DL. Amnestic mci future clinical status prediction using baseline mri features. Neurobiology of Aging. 2010;31(no. 9):1606–1617. doi: 10.1016/j.neurobiolaging.2008.09.003. [DOI] [PubMed] [Google Scholar]
- 2.Fan Y, Batmanghelich N, Clark CM, Davatzikos C. Spatial patterns of brain atrophy in mci patients, identified via high-dimensional pattern classification, predict subsequent cognitive decline. NeuroImage. 2008;39(no. 4):1731–1743. doi: 10.1016/j.neuroimage.2007.10.031. [DOI] [PMC free article] [PubMed] [Google Scholar]
- 3.Kloppel S, Stonnington CM, Chu C, Draganski B, Scahill RI, Rohrer JD, Fox NC, Jack CR, Ashburner J, Frackowiak RSJ. Automatic classification of mr scans in alzheimer's disease. Brain. 2008 Mar;131(no. 3):681–689. doi: 10.1093/brain/awm319. [DOI] [PMC free article] [PubMed] [Google Scholar]
- 4.Gatz M, R CA, Fratiglioni L, Johansson B, Mortimer JA, Berg S, Fiske A, Pedersen NL. Role of genes and environments for explaining Alzheimer disease. Archives of general psychiatry. 2006 Feb;63(no. 2):168–174. doi: 10.1001/archpsyc.63.2.168. [DOI] [PubMed] [Google Scholar]
- 5.Saunders AM, Strittmatter WJ, Schmechel D, St George-Hyslop PH, Pericak-Vance MA, Joo SH, Rosi BL, Gusella JF, Crapper-Maclachlan DR, Alberts MJ, et al. Association of apolipoprotein e allele varepsilon4 with late-onset familial and sporadic alzheimer's disease. Neurology. 2011;77(no. 10):950. doi: 10.1212/wnl.43.8.1467. [DOI] [PubMed] [Google Scholar]
- 6.Sabuncu MR, Buckner RL, Smoller JW, Lee PH, Fischl B, Sperling RA. The association between a polygenic alzheimer score and cortical thickness in clinically normal subjects. Cereb Cortex. 2011 doi: 10.1093/cercor/bhr348. [DOI] [PMC free article] [PubMed] [Google Scholar]
- 7.Zhang D, Wang Y, Zhou L, Yuan H, Shen D. Multimodal classification of alzheimer's disease and mild cognitive impairment. NeuroImage. 2011;55(no. 3):856–867. doi: 10.1016/j.neuroimage.2011.01.008. [DOI] [PMC free article] [PubMed] [Google Scholar]
- 8.Ye J, Chen K, Wu T, Li J, Zhao Z, Patel R, Bae M, Janardan R, Liu H, Alexander G, Reiman E. Heterogeneous data fusion for alzheimer's disease study, in. Proceedings of the 14th ACM SIGKDD international conference on Knowledge discovery and data mining; New York, NY, USA. 2008. pp. 1025–1033. KDD ′08. ACM. [Google Scholar]
- 9.Davatzikos C, Genc A, Xu D, Resnick SM. Voxel-based morphometry using the ravens maps: methods and validation using simulated longitudinal atrophy. Neuroimage. 2001 Dec;14(no. 6):1361–1369. doi: 10.1006/nimg.2001.0937. [DOI] [PubMed] [Google Scholar]
- 10.Pham DzungL, Prince JerryL. Adaptive fuzzy segmentation of magnetic resonance images. IEEE Trans Med Imaging. 1999;18(no. 9):737–752. doi: 10.1109/42.802752. [DOI] [PubMed] [Google Scholar]
- 11.Shen DG, Davatzikos C. Hammer: Hierarchical attribute matching mechanism for elastic registration. IEEE Trans Med Imag. 2002 Nov;21(no. 11):1421–1439. doi: 10.1109/TMI.2002.803111. [DOI] [PubMed] [Google Scholar]
- 12.Fan Y, Shen D, Gur RC, Gur RE, Davatzikos C. Compare: Classification of morphological patterns using adaptive regional elements. IEEE Trans Med Imaging. 2007;26(no. 1):93–105. doi: 10.1109/TMI.2006.886812. [DOI] [PubMed] [Google Scholar]
- 13.Vapnik VN. The nature of statistical learning theory. Springer-Verlag New York, Inc; New York, NY, USA: 1995. [Google Scholar]
- 14.Folstein MF, Folstein SE, McHugh PR. “mini-mental state”. a practical method for grading the cognitive state of patients for the clinician. J Psychiatr Res. 1975 Nov;12(no. 3):189–198. doi: 10.1016/0022-3956(75)90026-6. [DOI] [PubMed] [Google Scholar]


