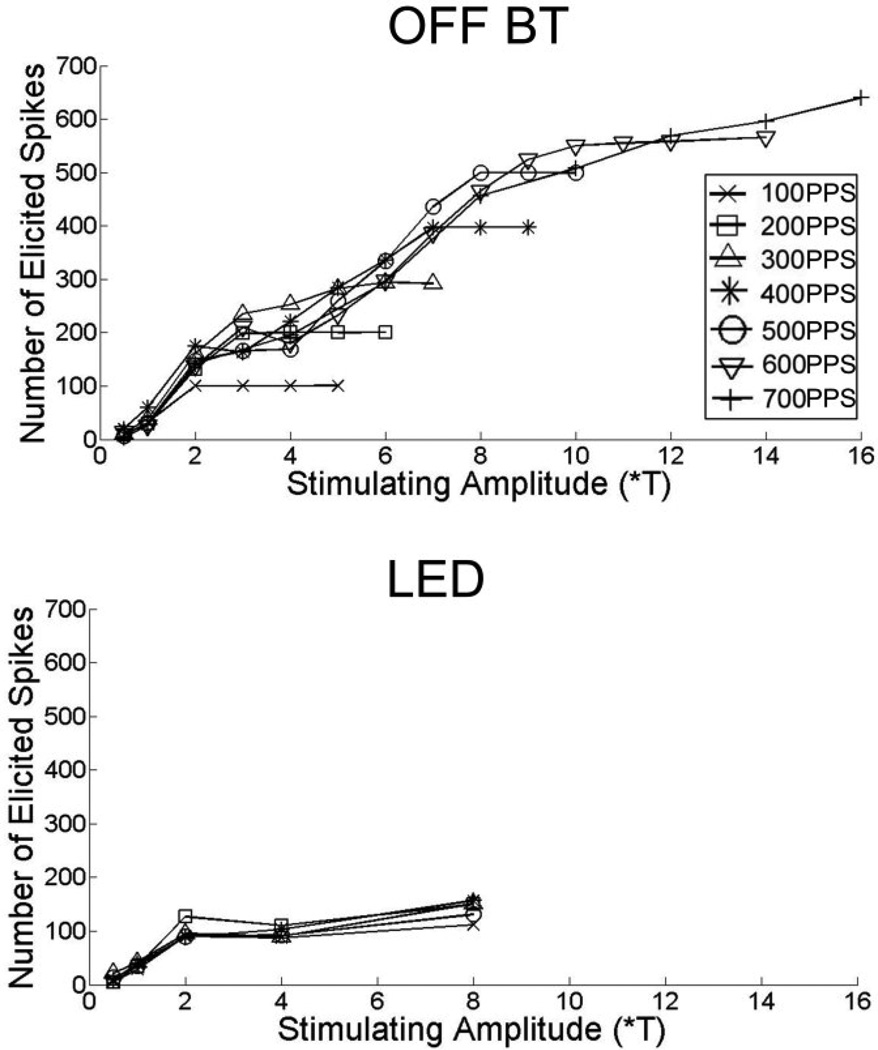
Fig. 1.
Spikes elicited as a function of amplitude. Each point represents the total number of spikes elicited in response to a 1-s train of pulses at pulse rates ranging from 100–700 PPS. (top) responses in a typical OFF-alpha cell. (bottom) Responses in a typical LED. Note the difference in vertical axes.

