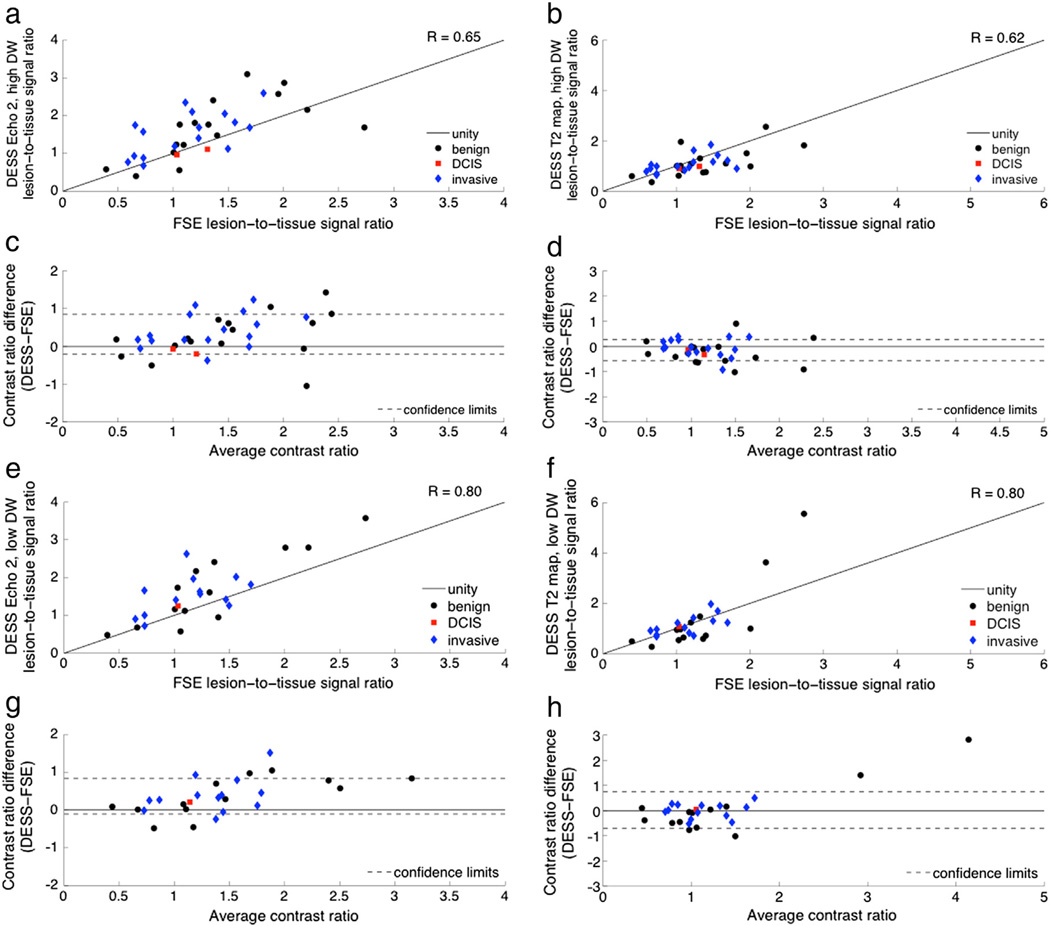
Fig. 10.
T2 weighting contrast comparison. Contrast ratios were calculated as the signal ratio between a lesion ROI and a fibroglandular ROI for a number of benign and malignant lesions. The T2 weighting was evaluated in DESS images (left column) and in T2 maps (right column). The contrast was evaluated in DESS images with high diffusion attenuation (a–d) and low diffusion attenuation (e–h). The contrast ratios for the DESS data are plotted against the contrast ratios for the FSE T2-weighted images (a, b, e, f) and are also shown on Bland–Altman plots with 96% confidence intervals (c, d, g, h).

