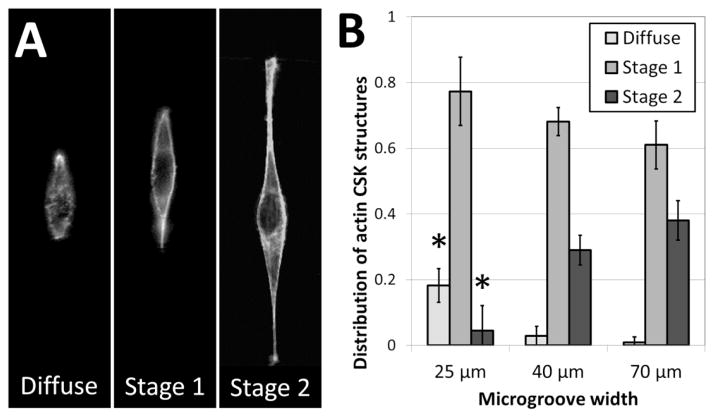
Figure 6.
Actin fiber structure in NIH 3T3 cells varies based on 3D cell morphology. (A) Representative images of the three categories into which actin fiber structures were classified. High-resolution imaging reveals that actin phenotypes were either (i) diffuse, (ii) formed fibers along the perimeter of the cell only (stage 1), or (iii) formed fibers along the perimeter and within the cell body (stage 2). (B) The fraction of cell populations displaying these phenotypes varies based on the width of the micropatterned microgroove. The occurrence of diffuse actin phenotypes decreases with increasing microgroove width, while the occurrence of stage 2 actin phenotypes increases with increasing microgroove width (* p < 0.01, as compared to all other fractions of the same phenotype; n = 3; 35–60 cells per sample).

