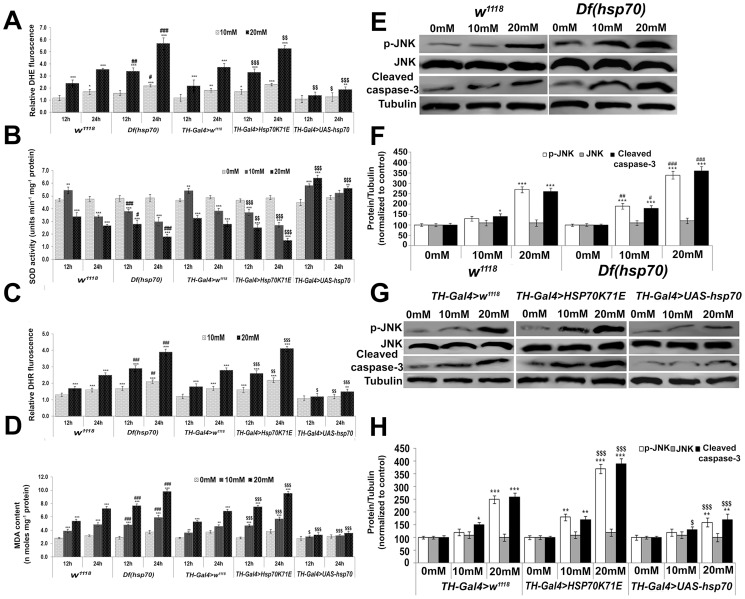
Figure 1. hsp70 over-expression in the dopaminergic neurons of Drosophila protect them from PQ-induced OS.
(A) Time and dose dependent increase in superoxide (O2 −) in the brain of PQ-exposed w1118, Df(hsp70), TH-Gal4>w1118 and TH-Gal4>Hsp70K71E flies and less generation of O2 − in exposed TH-Gal4>UAS-hsp70 flies as compared to TH-Gal4>w1118. (B) Decreased SOD activity in the brain of PQ-exposed w1118, Df(hsp70), TH-Gal4>w1118 and TH-Gal4>Hsp70K71E flies and an increased enzyme activity in exposed TH-Gal4>UAS-hsp70 flies. (C) Graphical representation of peroxynitrite (ONOO−) generation using DHR 123 staining. ONOO− generation was also found to be less like O2 − generation in PQ-exposed TH-Gal4>UAS-hsp70 flies. (D) Histogram depicting the extent of lipid peroxidation as determined by MDA content in w1118, Df(hsp70), TH-Gal4>Hsp70K71E and TH-Gal4>UAS-hsp70 flies. (E) Representative immuno-blot images of p-JNK, JNK and cleaved caspase-3 levels in the protein samples from brain tissues of control and PQ-exposed w1118 and Df(hsp70) flies. (F) Densitometry analysis of data normalized against loading control tubulin. (G) Representative immuno-blotting images of TH-Gal4>w1118, TH-Gal4>HSP70K71E and TH-Gal4>UAS-hsp70 flies. (H) Densitometry analysis of data normalized against loading control tubulin. Values are mean ± SD (n = 3). Significance were ascribed as *p<0.05, **p<0.01 and ***p<0.001 vs. control; $ p<0.05, $$ p<0.01 and $$$ p<0.001 vs. TH-Gal4>w1118; # p<0.05, ## p<0.01 and ### p<0.001 vs. w1118.

