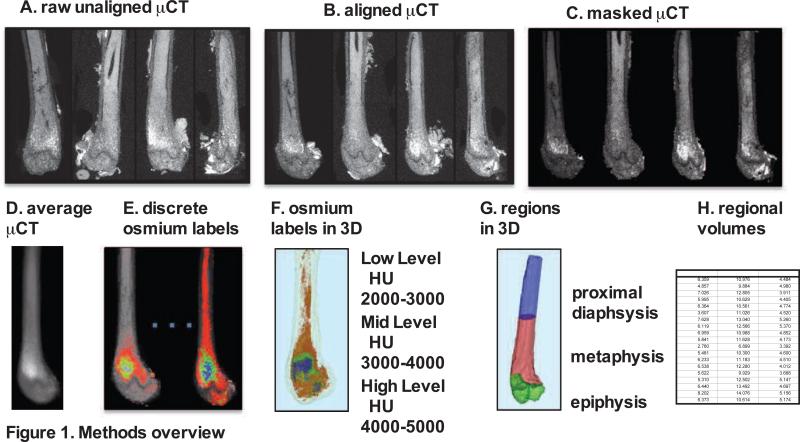
Figure 1. Overview of method for visualization and quantification of marrow adipose tissue (MAT).
Osmium-stained femorae were visualized via μCT. Femorae (A) were rigidly aligned (B). Bone masks (C) were averaged (D). Osmium within the bone mask was quantified as volumetric (mm3) measurements of low (red), mid (green) and high (blue) osmium containing regions in the femur and (E) overlaid on μCT images for viewing. 3D rendering of osmium regions (F) with same coloring as 3E, colors slightly offset due to transparent bone mask. In (G) we subdivided the femur into three anatomical regions of interest. (H) This is a pictorial representation of a data spreadsheet containing regional osmium measurements as osmium volume normalized to total femoral volume (in %).

