
FIGURE 2.
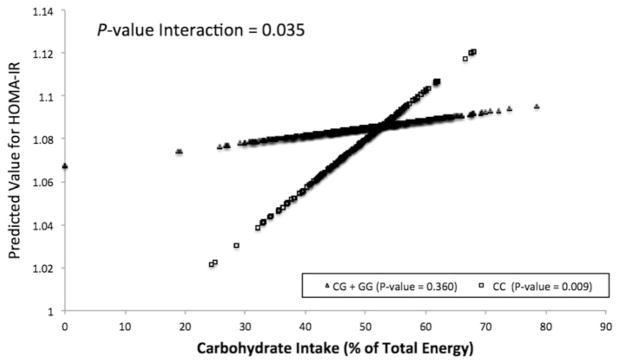
Gene–diet interaction for HOMA-IR in the North American population. Predicted values of HOMA-IR according to CRY1 rs2287161 genotype plotted against carbohydrate intake (% of total energy) evaluated continuously. Predicted values for HOMA-IR (natural log) were calculated from the regression model after adjustment for age, sex, BMI, center location and family structure. p Values indicate the statistical significance of the interaction term in the adjusted regression model, the statistical significance of the adjusted regression coefficient in the regression line corresponding to CRY1 minor allele homozygotes and the statistical significance of the adjusted regression coefficient in the regression line to carriers of the CRY1 major allele. HOMA-IR, homeostasis model assessment- estimated insulin resistance.