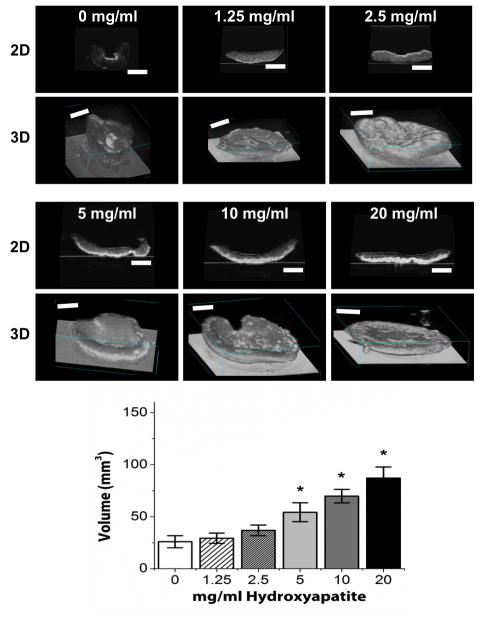
Figure 4.
Ultrasound images showing 2D sections (upper panels) and 3D volume renderings (lower panels) of COL/FIB/HA constructs after 7 days of unconstrained culture. Graph shows quantification of construct volume at each HA concentration. n = 4. *Statistical significance (p<0.05) against 0 mg/ml (pure collagen/fibrin). Scale bar = 1 mm.

