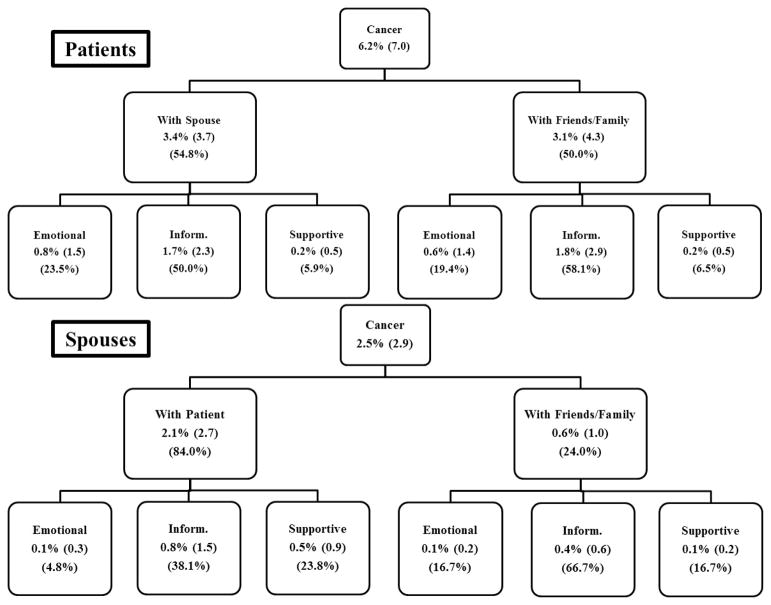
Figure 1.
Patients’ and spouses’ percentage of total conversations that were about cancer, and that comprised different conversation types.
Note. The first row is mean % of all conversations that were about cancer (and SD). The second row is % of conversations that were about cancer and with the spouse or friends/family, and numbers below in parentheses are % of cancer conversations in each social context. The last row is % of conversations that were categorized as each type of conversation, and numbers below in parentheses are % of cancer conversations with the spouse or friends/family. All means are from the entire sample.

